
Macronutrient Calculator
Macronutrient Calculator
Enter your daily calories and a protein, carbohydrate and fat split. The three percentages must add up to 100.
Presets:
A macronutrient calculator turns a daily calorie target into grams of protein, carbohydrate and fat. Enter your calories and a percentage split, and this tool gives you the grams and calories for each macro, plus protein per kilogram of body weight when you add your weight, and a per-meal split when you add a meal count.
How do I use the macronutrient calculator?
Start with a daily calorie figure you already have. If you do not have one yet, work one out first with the Basal Metabolic Rate Calculator and build from there, because this tool splits a calorie target rather than estimating one. Type that figure into the daily calories box, then set the three percentages. You can type your own split, or use one of the preset buttons: Balanced 30/40/30, High-protein 40/30/30, Low-carb 40/20/40, or Keto 25/5/70. Each preset fills the three percentage boxes, and you can still adjust any figure by hand afterwards.
The three percentages must add up to 100. If they add up to anything else, the tool shows an error message and no results, which is deliberate: a split that adds up to 90% would leave 10% of your calories unassigned, and a split that adds up to 110% would count calories twice. Body weight in kilograms is optional. Add it only if you want the protein-per-kilogram figure, which puts your protein grams beside your body weight so the two can be compared. Meals per day is also optional and starts at 3. Add a different meal count if you want the daily grams divided evenly across your meals. Press Calculate macros, and the result boxes show protein, carbohydrate and fat in grams with the calories each one supplies.
Read the results as daily targets, not as a meal plan. The tool does not choose foods for you, and it does not split the day unevenly between meals. A per-meal figure is the daily total divided by the number of meals, so it is a planning aid: real meals will vary, and that variation is normal. If a result looks wrong, check the three inputs first — the calorie figure, the three percentages, and whether they add up to 100 — before doubting the arithmetic, because most errors in macro maths come from the inputs rather than the formula.
How do I choose a macro split?
There is no single split that suits every person, and the presets on this tool are starting points, not prescriptions. The Balanced preset, 30% protein, 40% carbohydrate and 30% fat, keeps all three macros in play and is a plain place to start if you have no reason to favour one macro over another. The High-protein preset, 40% protein, 30% carbohydrate and 30% fat, raises the protein share at the expense of carbohydrate. The Low-carb preset, 40% protein, 20% carbohydrate and 40% fat, cuts carbohydrate further and makes up the difference with fat. The Keto preset, 25% protein, 5% carbohydrate and 70% fat, is the most extreme of the four, with carbohydrate reduced to a small share and fat supplying most of the calories.
Choose by thinking about what you already know about your eating pattern, rather than by picking the preset with the most striking name. If your current meals are already rich in carbohydrate foods such as rice, bread, oats and fruit, a balanced or high-protein split will feel closer to your normal pattern than a keto split. If you eat very little carbohydrate already, a low-carbohydrate split may be easier to follow than a balanced one. The point of the comparison table further down this page is to make that choice concrete: at the same 2,000 kcal, the four presets give visibly different gram figures, and seeing those figures side by side is more useful than comparing percentages alone.
Whatever split you pick, keep the total in view. A percentage is a share of a calorie total, so the same percentage gives different grams at different calorie levels. Thirty percent protein is 150 g at 2,000 kcal, but 120 g at 1,600 kcal and 225 g at 3,000 kcal. That is why this tool asks for calories first: without a calorie figure, a percentage cannot be turned into grams at all. If your calorie target changes, run the tool again rather than carrying old gram figures forward, because every gram figure in the result depends on that total.
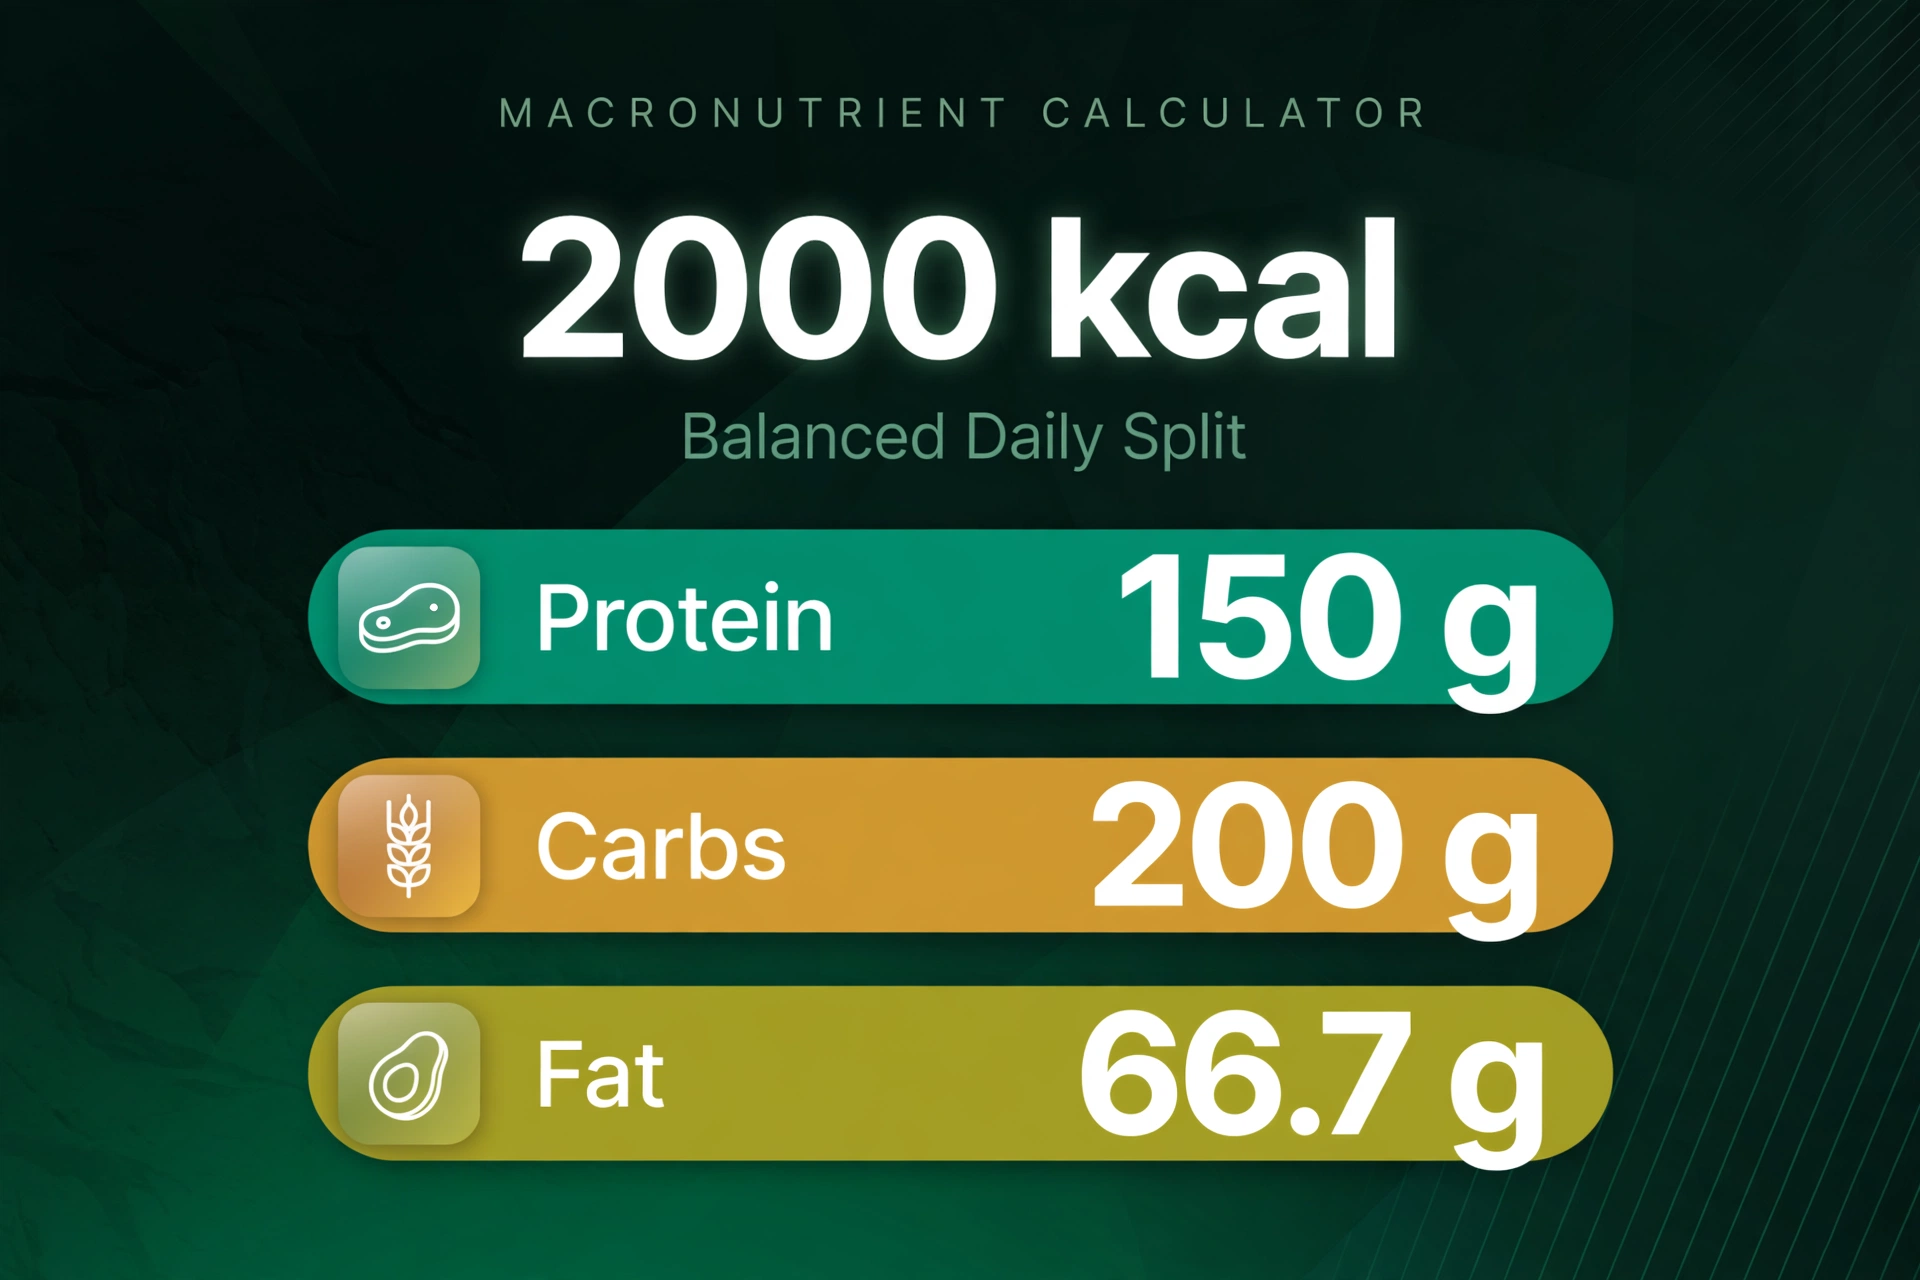
A worked example from the live tool
Take a daily target of 2,000 kcal with the Balanced split: 30% protein, 40% carbohydrate and 30% fat, no body weight entered, and 3 meals per day. This is Test 1 in the verified tests table at the end of this page, and every figure below comes from that test.
First, turn each percentage into calories. Thirty percent of 2,000 kcal is 600 kcal for protein. Forty percent of 2,000 kcal is 800 kcal for carbohydrate. Thirty percent of 2,000 kcal is 600 kcal for fat. Those three calorie figures add up to 2,000 kcal, which is a useful check: if they did not, the percentages would not add up to 100%.
Next, turn calories into grams. Protein supplies 4 kcal per gram, so 600 kcal divided by 4 gives 150.0 g of protein. Carbohydrate also supplies 4 kcal per gram, so 800 kcal divided by 4 gives 200.0 g of carbohydrate. Fat supplies 9 kcal per gram, so 600 kcal divided by 9 gives 66.666… g, shown rounded to one decimal place as 66.7 g of fat. That rounding is worth noticing: multiplying 66.7 g back by 9 gives 600.3 kcal, a fraction above 600 kcal, purely because of rounding to one decimal place. The tool rounds for display; the underlying division is 600 divided by 9.
Finally, divide by meals. With 3 meals per day, protein is 150.0 g divided by 3, which is 50.0 g per meal. Carbohydrate is 200.0 g divided by 3, which is 66.7 g per meal. Fat is 66.666… g divided by 3, which is 22.222… g, shown as 22.2 g per meal. The per-meal figures are even splits, so a day of three equal meals would match them, while a day with a larger dinner and a smaller breakfast would not — and that is fine, because the daily total is the figure the tool is built to give.
How does the 4/4/9 maths work?
The maths has two steps, and keeping them separate makes errors easy to spot. Step one is the share: multiply your daily calories by the macro percentage and divide by 100. Step two is the conversion: divide protein calories by 4, carbohydrate calories by 4, and fat calories by 9. In formula form:
- Protein grams = calories × protein % / 100 / 4
- Carbohydrate grams = calories × carbohydrate % / 100 / 4
- Fat grams = calories × fat % / 100 / 9
You can also check a result in reverse. Multiply protein grams by 4, carbohydrate grams by 4 and fat grams by 9, then add the three results. Apart from small rounding differences, the total should match your daily calories. For the worked example: 150.0 × 4 = 600, 200.0 × 4 = 800, and 66.7 × 9 = 600.3, giving 2,000.3 kcal against a 2,000 kcal target. The 0.3 kcal gap is rounding, not a mistake in the formula.
Why does fat move less than protein or carbohydrate when percentages change?
Because fat carries more energy per gram. A one-percentage-point change at 2,000 kcal is 20 kcal. For protein or carbohydrate, 20 kcal divided by 4 is 5 g. For fat, 20 kcal divided by 9 is about 2.2 g. So moving 10 percentage points from carbohydrate to fat, at 2,000 kcal, takes 50 g off carbohydrate (200 kcal divided by 4) and adds only about 22.2 g of fat (200 kcal divided by 9). The calories move in equal amounts, but the grams do not.
That is also why fat gram figures often look small beside carbohydrate figures even when their calorie shares are equal. In the worked example, protein and fat each supply 30% of calories and 600 kcal, yet protein is 150.0 g and fat is 66.7 g. Nothing has gone missing. The same calories are simply packed into fewer grams when the nutrient is fat. The same effect runs the other way in the keto preset: 70% fat at 2,000 kcal is 1,400 kcal, which is 155.6 g of fat, while 25% protein at the same level is 500 kcal, which is 125.0 g of protein. Fat still supplies far more calories, even though the gram figures are closer than the percentages suggest.
What do the four presets give at 2000 kcal?
The table below holds calories fixed at 2,000 kcal and changes only the split, so each row can be compared directly with the others. Every figure was computed with the same formulas as the tool.
| Preset | Protein % / Carb % / Fat % | Protein | Carbohydrate | Fat |
|---|---|---|---|---|
| Balanced | 30 / 40 / 30 | 150.0 g (600 kcal) | 200.0 g (800 kcal) | 66.7 g (600 kcal) |
| High-protein | 40 / 30 / 30 | 200.0 g (800 kcal) | 150.0 g (600 kcal) | 66.7 g (600 kcal) |
| Low-carb | 40 / 20 / 40 | 200.0 g (800 kcal) | 100.0 g (400 kcal) | 88.9 g (800 kcal) |
| Keto | 25 / 5 / 70 | 125.0 g (500 kcal) | 25.0 g (100 kcal) | 155.6 g (1,400 kcal) |
Read the table row by row to see what each preset trades. High-protein keeps fat at 66.7 g, the same as Balanced, and moves 200 kcal from carbohydrate to protein, which raises protein from 150.0 g to 200.0 g and lowers carbohydrate from 200.0 g to 150.0 g. Low-carb also gives 200.0 g of protein, but cuts carbohydrate to 100.0 g and raises fat to 88.9 g. Keto is a different shape altogether: carbohydrate falls to 25.0 g, protein falls back to 125.0 g, and fat rises to 155.6 g. At any other calorie level, the same presets will give different grams, so use the tool itself rather than scaling this table by eye if your target is not 2,000 kcal.
What percentage ranges do published guidance give for most healthy adults?
Published Acceptable Macronutrient Distribution Ranges (AMDR) for most healthy adults are: protein 10–35% of calories, carbohydrate 45–65% of calories, and fat 20–35% of calories. These are broad ranges, not a single target, and they describe the share of calories from each macro across a whole pattern of eating. They are included here as background context only. They do not tell any individual reader which percentage to pick, and this page does not recommend a personal target.
Notice how the presets relate to those ranges. Balanced, at 30/40/30, sits inside the protein and fat ranges but below the carbohydrate range, because its carbohydrate share is 40% against a published range starting at 45%. High-protein, at 40/30/30, sits above the published protein range and below the carbohydrate range. Low-carb, at 40/20/40, sits above the protein and fat ranges and well below the carbohydrate range. Keto, at 25/5/70, sits inside the protein range but far outside the carbohydrate and fat ranges. That comparison is not a judgement on any preset. It simply shows that presets are named eating patterns with their own logic, while the AMDR ranges describe a broad middle ground. A reader comparing the two should not expect a named preset to fall neatly inside all three ranges at once.
What mistakes do people make with macro percentages?
The most common mistake is entering percentages that do not add up to 100. It is easy to do: type 30, 40 and 20, add them in your head as 100, and miss that they add up to 90. This tool refuses that input and shows the sum-to-100 error with no results, as in Test 4 below, rather than silently leaving 10% of calories unassigned. If you see that error, adjust one percentage until the three add up to 100, and check the total before pressing Calculate again.
The second mistake is confusing a percentage with grams. A percentage is a share, and grams are an amount. Thirty percent protein is not 30 g of protein. At 2,000 kcal it is 150 g, at 1,600 kcal it is 120 g, and at 3,000 kcal it is 225 g. Anyone copying a gram figure from one calorie level to another without recalculating will carry the wrong amount forward. The fix is simple: whenever the calorie figure changes, run the tool again.
The third mistake is treating fat grams as comparable to carbohydrate grams. Because fat supplies 9 kcal per gram against 4 kcal per gram for carbohydrate, equal gram figures mean very different calories. One hundred grams of fat is 900 kcal, while 100 g of carbohydrate is 400 kcal. Judging a split by gram figures alone, without looking at the calorie column beside them, will understate how much energy fat supplies. The result boxes on this tool show grams and calories together for exactly that reason: read both columns before deciding whether a split looks the way you expected.
A fourth, quieter mistake is rounding the wrong way by hand. Fat divisions rarely come out whole: 600 divided by 9 is 66.666… g, and 800 divided by 9 is 88.888… g. Rounding 66.666… g to 67 g is not wrong in itself, but mixing rounded figures from different sources — one page showing 67 g, another showing 66.7 g — can look like a disagreement when it is only a rounding choice. This tool shows grams to one decimal place throughout, so 66.7 g and 88.9 g are the figures to compare against, not whole-gram approximations from elsewhere.
What does this calculator not cover?
This calculator covers the split of a calorie target into three macros. It does not cover everything else about food. Alcohol supplies about 7 kcal per gram, but it is not one of the three macros, and it is not counted here. If alcohol forms part of your intake, the calories it supplies sit outside the protein, carbohydrate and fat totals this tool gives, so the three macro calorie figures will not describe your full intake on their own.
Food quality is also outside this tool. Two days can share identical macro grams while differing entirely in the foods behind them: one built on vegetables, legumes, whole grains, fish and nuts, the other built on highly processed foods with the same protein, carbohydrate and fat totals. Micronutrients — vitamins and minerals — are not covered either, and neither is fibre as a separate figure, since fibre sits inside the carbohydrate total. A macro split is a map of energy shares, not a verdict on a whole diet.
Individual needs vary, and this tool does not adjust for them. Age, sex, activity level, training, health conditions, pregnancy, and many other factors can change what calorie figure or split is suitable for a person, and none of those factors are inputs here. That is why the tool starts from a calorie figure you supply rather than estimating one: it keeps its own job narrow and leaves the calorie estimate, and any health decision, to a separate step. For body composition context alongside a calorie figure, the FFMI Calculator gives a fat-free mass index from height, weight and body fat percentage. For the full set of tools in this category, see the Calculators category hub.
Is my information stored or shared?
The calculator works from the numbers you type on the page and shows the results on the same page. It does not ask for your name, email address, or any account detail, and the optional weight and meal-count fields exist only to produce the per-kilogram and per-meal figures. Nothing in the tool requires you to sign in, and there is no result to download or share from the tool itself. If you close the page, your inputs go with it.
What do people ask about macronutrient calculators?
How do I calculate macros from calories?
Multiply your daily calories by each macro percentage, divide by 100 to get calories for that macro, then divide protein and carbohydrate calories by 4 and fat calories by 9. For example, at 2,000 kcal with 30% protein, 40% carbohydrate and 30% fat, the results are 150.0 g protein (600 kcal), 200.0 g carbohydrate (800 kcal) and 66.7 g fat (600 kcal).
What is a 30/40/30 split at 2000 kcal?
A 30/40/30 split at 2,000 kcal gives 150.0 g protein (600 kcal), 200.0 g carbohydrate (800 kcal) and 66.7 g fat (600 kcal). With 3 meals per day, the per-meal split is 50.0 g protein, 66.7 g carbohydrate and 22.2 g fat.
What does protein per kilogram of body weight tell me?
It puts your protein grams beside your body weight so the two can be compared directly. For example, at 2,500 kcal with a 40/30/30 split and a body weight of 80 kg, protein is 250.0 g, which is 3.13 g per kilogram of body weight. The figure only appears when you enter a weight.
How do per-meal grams work?
Per-meal grams are the daily grams divided evenly by the number of meals. At 2,500 kcal with a 40/30/30 split and 4 meals per day, the per-meal split is 62.5 g protein, 46.9 g carbohydrate and 20.8 g fat. Real meals will vary around those figures; the daily total is the figure to track.
Why is the fat figure lower in grams than the carbohydrate figure?
Because fat supplies 9 kcal per gram while carbohydrate supplies 4 kcal per gram. At 2,000 kcal with the Keto preset (25/5/70), fat is 155.6 g (1,400 kcal) and carbohydrate is only 25.0 g (100 kcal), yet the calorie gap is far larger than the gram gap suggests. Always read grams beside calories.
What happens if my percentages do not add up to 100?
The tool shows a sum-to-100 error and no results. For example, percentages of 30, 40 and 20 add up to 90, so the tool shows the error and calculates nothing. Adjust one percentage until the three add up to 100, then calculate again.
Disclaimer
This page gives general information about converting a calorie target into macronutrient grams. It is not diet advice, medical advice, or a personal nutrition plan, and it does not recommend any calorie target or macro split for any individual reader. No qualified reviewer has reviewed this page. If you have a health condition, are pregnant, or are making a major change to how you eat, speak to a qualified health professional first. The figures are estimates based on the calories and percentages you enter, and individual needs vary.
How do I calculate macros from calories?
Multiply your daily calories by each macro percentage, divide by 100 to get calories for that macro, then divide protein and carbohydrate calories by 4 and fat calories by 9. For example, at 2,000 kcal with 30% protein, 40% carbohydrate and 30% fat, the results are 150.0 g protein (600 kcal), 200.0 g carbohydrate (800 kcal) and 66.7 g fat (600 kcal).
What is a 30/40/30 split at 2000 kcal?
A 30/40/30 split at 2,000 kcal gives 150.0 g protein (600 kcal), 200.0 g carbohydrate (800 kcal) and 66.7 g fat (600 kcal). With 3 meals per day, the per-meal split is 50.0 g protein, 66.7 g carbohydrate and 22.2 g fat.
What does protein per kilogram of body weight tell me?
It puts your protein grams beside your body weight so the two can be compared directly. For example, at 2,500 kcal with a 40/30/30 split and a body weight of 80 kg, protein is 250.0 g, which is 3.13 g per kilogram of body weight. The figure only appears when you enter a weight.
How do per-meal grams work?
Per-meal grams are the daily grams divided evenly by the number of meals. At 2,500 kcal with a 40/30/30 split and 4 meals per day, the per-meal split is 62.5 g protein, 46.9 g carbohydrate and 20.8 g fat. Real meals will vary around those figures; the daily total is the figure to track.
Why is the fat figure lower in grams than the carbohydrate figure?
Because fat supplies 9 kcal per gram while carbohydrate supplies 4 kcal per gram. At 2,000 kcal with the Keto preset (25/5/70), fat is 155.6 g (1,400 kcal) and carbohydrate is only 25.0 g (100 kcal), yet the calorie gap is far larger than the gram gap suggests. Always read grams beside calories.
What happens if my percentages do not add up to 100?
The tool shows a sum-to-100 error and no results. For example, percentages of 30, 40 and 20 add up to 90, so the tool shows the error and calculates nothing. Adjust one percentage until the three add up to 100, then calculate again.