
Ideal Weight Calculator
Enter your height and sex to see your ideal weight from four standard formulas, plus the healthy weight range for your height.
These figures are population estimates from height and sex alone. They are not a personal target and not medical advice.
An ideal weight calculator estimates a reference weight from height and sex, using four standard formulas — Devine, Robinson, Miller and Hamwi — and shows the healthy weight range for that height alongside them. The four figures are estimates, not a target to aim for.
What does ideal weight mean?
Ideal weight, also called ideal body weight, is a reference figure worked out from height and sex alone. It does not measure body fat, muscle, bone size, age, or health. It answers a narrow question: given a height and a sex, what weight do the standard formulas produce? That is all it answers, and the rest of this article is about reading the answer with that limit in mind.
The phrase itself can mislead. The word ideal sounds like a goal, as if one number were the right weight for a person and every other weight were wrong. The formulas do not support that reading. Four formulas give four different numbers for the same person, and the healthy BMI range for the same height is wider still. For a woman who is 5 ft 7 in tall, the four formulas give 60.9 to 62.6 kg, while the healthy BMI range runs from 53.6 to 72.1 kg. If ideal weight were a single true value, the formulas would agree and the range would be narrow. They do not agree, and the range is not narrow, so the honest way to use this tool is to look at the spread and the range together, not to pick one figure and treat it as a personal target.
The formulas were also built for clinical jobs, not for personal weight goals. Devine's formula was published to help work out drug doses. Hamwi's came from diabetes diet planning. Robinson and Miller were fitted to old height and weight tables from life insurance records. None of them was tested as a way of finding the weight at which a particular person is healthiest. Modern health guidance describes a healthy weight as a range, using BMI 18.5 to 24.9, rather than a single ideal number. This page follows that approach: it shows the four formula figures, then shows the range, and it does not rank one formula above the others as the one to follow.
To estimate daily energy needs from your height, weight, age and activity, use the basal metabolic rate calculator.
How do I use the Ideal Weight Calculator?
Choose the height unit first. If you use feet and inches, enter feet in the first field and inches in the second. A height of 5 ft 7 in goes in as 5 feet and 7 inches. If you use centimetres, enter the whole height in the centimetres field instead. A height of 170 cm goes in as 170. Then choose female or male from the sex selector and press the calculate button.
The tool shows five labelled boxes. Four of them carry the formula names: Devine, Robinson, Miller and Hamwi. Each one shows a weight in kilograms, with pounds in brackets. The fifth box shows the healthy weight range for that height, from BMI 18.5 to BMI 24.9, also in kilograms with pounds in brackets. The boxes appear together, because no single box is the answer on its own. Read them as a set: four close estimates in the middle of a wider healthy range.
Measure height without shoes, standing straight against a wall or with a stadiometer if one is available. A height taken in shoes, or guessed from memory, can shift every figure on the page. One inch of height changes the Devine figure by 2.3 kg, so a one-inch error moves the result by more than the gap between some of the formulas. Check the unit before you calculate as well. A height entered as 170 in the feet field would be treated as 170 feet, and the tool will flag it as too high, but a height of 67 entered in the centimetres field would pass the checks and give a wrong result, because 67 cm is a child's height, not an adult's. The unit selector decides which field the tool reads, so make sure the number sits in the field that matches the unit you chose.
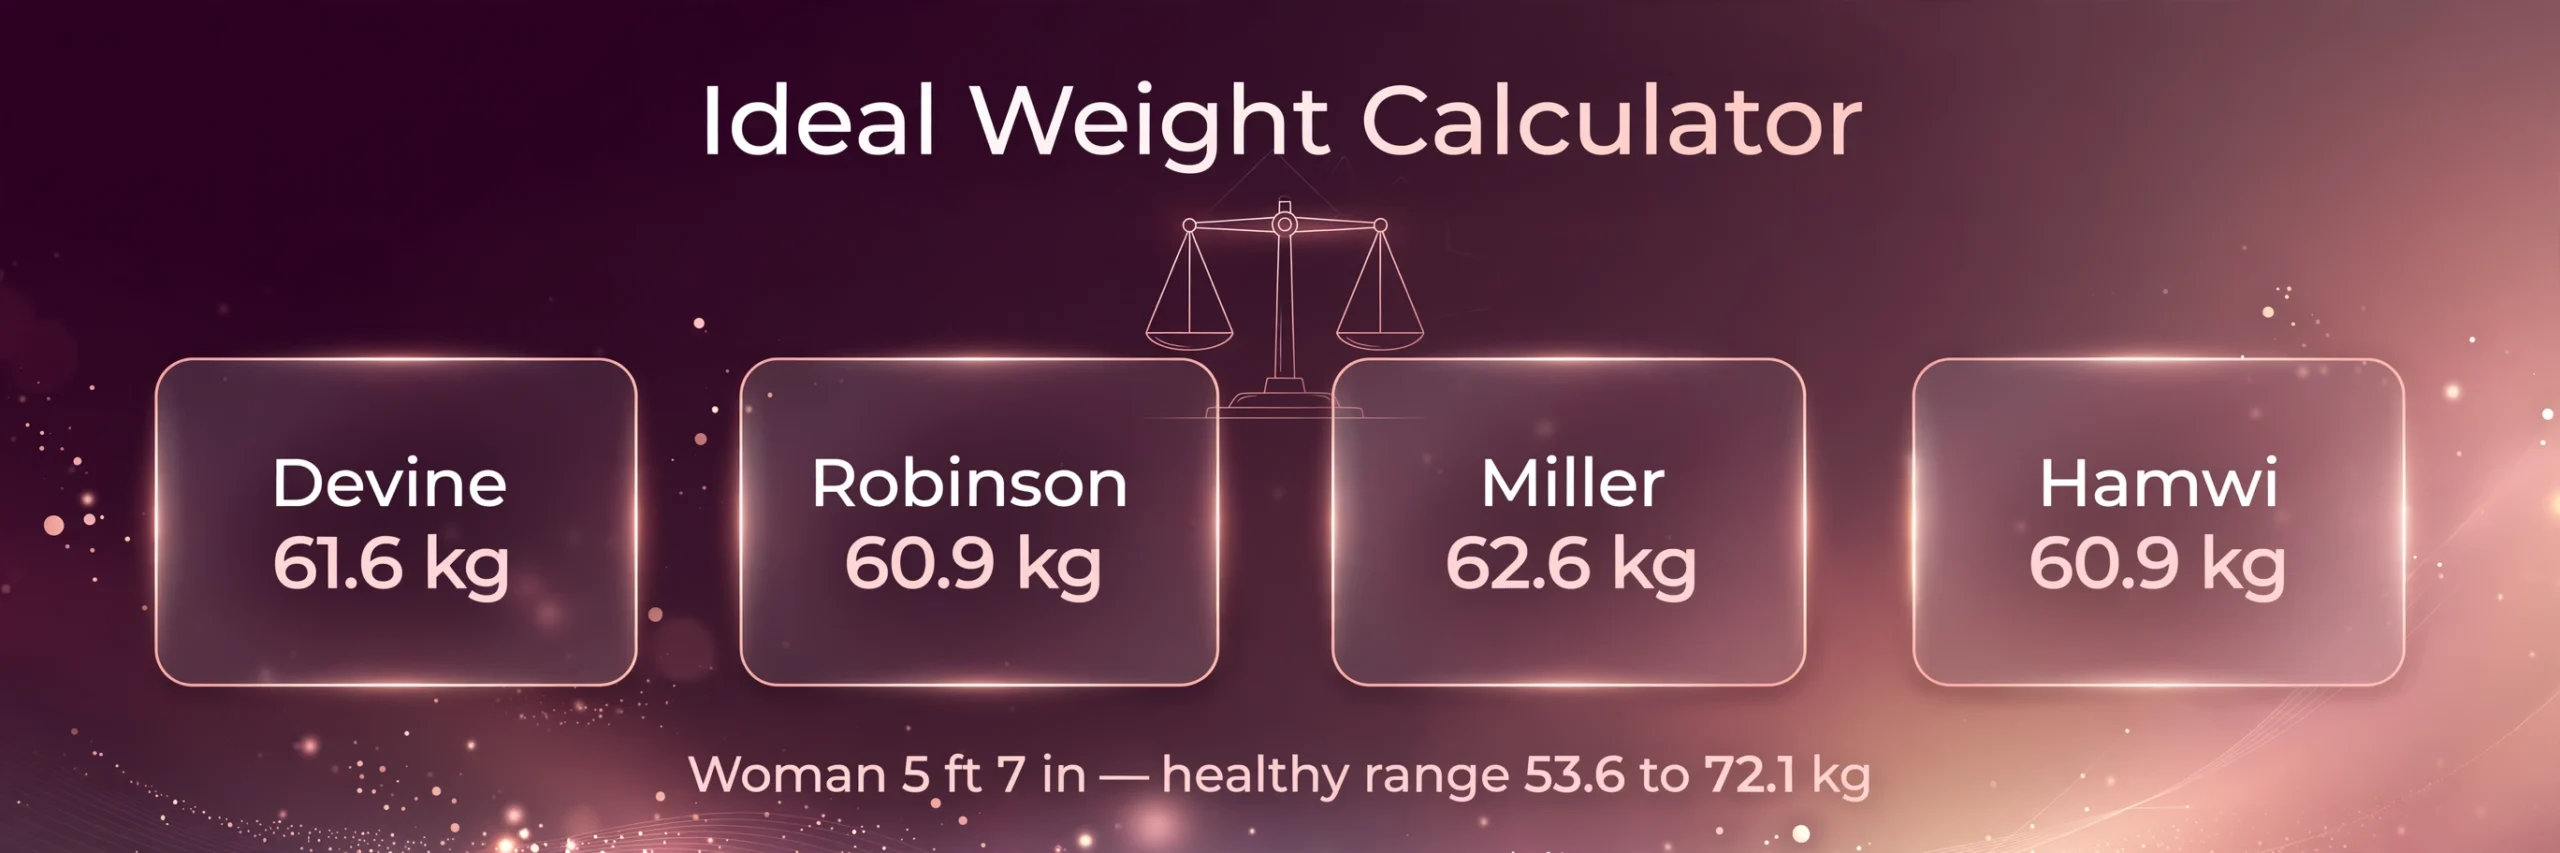
A worked example from the live tool
Take the primary example: a woman who is 5 ft 7 in tall. Five feet is 60 inches, so 5 ft 7 in is 67 inches, which is 7 inches over 5 ft. Every formula starts from its base weight at 5 ft and adds a fixed amount for each of those 7 inches. That shared shape is what makes the worked example easy to follow, and the different base weights and per-inch amounts are what make the answers differ.
Devine gives 45.5 plus 2.3 multiplied by 7. The multiplication gives 16.1, and 45.5 plus 16.1 is 61.6 kg. In pounds, 61.6 multiplied by 2.20462 is 135.8 lb. Robinson gives 49 plus 1.7 multiplied by 7. The multiplication gives 11.9, and 49 plus 11.9 is 60.9 kg, which is 134.3 lb. Miller gives 53.1 plus 1.36 multiplied by 7. The multiplication gives 9.52, and 53.1 plus 9.52 is 62.62 kg, which the tool rounds to 62.6 kg, or 138.1 lb. Hamwi gives 45.5 plus 2.2 multiplied by 7. The multiplication gives 15.4, and 45.5 plus 15.4 is 60.9 kg, which is also 134.3 lb. Robinson and Hamwi land on the same figure here by coincidence: Robinson starts higher and adds less per inch, Hamwi starts lower and adds more per inch, and at 7 inches over 5 ft the two lines meet.
The healthy BMI range for the same height is worked out differently. Height in metres is 67 multiplied by 0.0254, which is 1.7018 m. Squaring that gives 2.8961. Multiply by 18.5 and the lower end is 53.58 kg, which rounds to 53.6 kg, or 118.1 lb. Multiply by 24.9 and the upper end is 72.11 kg, which rounds to 72.1 kg, or 159.0 lb. The full result for a woman 5 ft 7 in tall is therefore Devine 61.6 kg (135.8 lb), Robinson 60.9 kg (134.3 lb), Miller 62.6 kg (138.1 lb), Hamwi 60.9 kg (134.3 lb), and a healthy BMI range of 53.6–72.1 kg (118.1–159.0 lb). The four formula figures sit close together near the middle of the range, and the range itself is about 18.5 kg wide.
The same height for a man gives a different set of figures, because every formula uses a higher base weight for men. Devine gives 50 plus 16.1, which is 66.1 kg (145.7 lb). Robinson gives 52 plus 13.3, which is 65.3 kg (144.0 lb). Miller gives 56.2 plus 9.87, which is 66.07 kg, rounded to 66.1 kg (145.7 lb). Hamwi gives 48 plus 18.9, which is 66.9 kg (147.5 lb). The healthy BMI range is the same as for a woman of the same height, 53.6–72.1 kg, because the BMI range depends on height alone and not on sex. That is a useful check on what each part of the tool does: the formula boxes change with sex, and the range box does not.
Entering the same woman's height as 170 cm instead of 5 ft 7 in gives figures a fraction lower, because 170 cm is 66.93 inches, slightly less than 67 inches. Devine gives 61.4 kg (135.4 lb), Robinson 60.8 kg (134.0 lb), Miller 62.5 kg (137.8 lb), Hamwi 60.7 kg (133.9 lb), and the healthy range is 53.5–72.0 kg (117.9–158.6 lb). The difference from the feet-and-inches result is under 0.2 kg on every figure, and it comes only from the 0.07-inch difference between 170 cm and 5 ft 7 in. A reader who enters 170 cm and a reader who enters 5 ft 7 in are describing almost the same height, so their results should be almost the same, and they are.
What is the Devine formula?
The Devine formula is the one most often used in hospital drug dosing. B. J. Devine published it in 1974 in a short pharmacy note about gentamicin, an antibiotic whose dose is worked out from lean body weight rather than total weight. The formula is 50 kg plus 2.3 kg for each inch over 5 ft for men, and 45.5 kg plus 2.3 kg for each inch over 5 ft for women. The per-inch amount is the same for both sexes, and only the base weight differs.
Devine later explained that the formula was not fitted to a published data set. It rested on the working estimates of his mentor, Dr. Margaret McCarron. That history matters, because it means the Devine figure is a clinical convention that proved useful for dosing, not a measurement of what weight keeps a person healthy. Its wide use in hospitals is a reason to know it, and it is not a reason to treat it as a personal goal. The formula also has the steepest slope of the four, at 2.3 kg per inch, so it pulls away from the others as height rises. At 5 ft it gives the lowest female figure of the four, 45.5 kg against Miller's 53.1 kg, and by 6 ft it gives the highest, 73.1 kg against Robinson's 69.4 kg.
What is the Robinson formula?
Robinson and colleagues published their formula in 1983 as a data-based check on Devine. They fitted it to the median weights in the 1959 Metropolitan Life height and weight tables, which were built from life insurance policyholders in the United States and Canada. The formula is 52 kg plus 1.9 kg for each inch over 5 ft for men, and 49 kg plus 1.7 kg for each inch over 5 ft for women. Its slope is gentler than Devine's, so it rises more slowly with height, and its base weights sit between Devine's and Miller's.
The source of the data is also its limit. The 1959 tables describe a group that skewed white and middle class, and that was measured decades ago, so the median weights in those tables may not describe other populations or present-day bodies. Robinson is often described as the most widely cited of the four in medical writing, and that citation record reflects its data-based origin rather than any proof that it picks a healthier weight for an individual. For a woman 5 ft 7 in tall it gives 60.9 kg, the joint lowest of the four figures in the worked example, and for a man of the same height it gives 65.3 kg, the lowest of the four male figures.
What is the Miller formula?
Miller and colleagues also published in 1983, fitted to the newer 1983 Metropolitan Life height and weight tables. The formula is 56.2 kg plus 1.41 kg for each inch over 5 ft for men, and 53.1 kg plus 1.36 kg for each inch over 5 ft for women. It has the highest base weight of the four and the gentlest slope, so it gives the highest figure at short and average heights and is overtaken by the steeper formulas only at taller heights.
For a woman 5 ft 7 in tall, Miller gives 62.6 kg, the highest of the four figures in the worked example. For a man of the same height it gives 66.1 kg, tied with Devine after rounding. The pattern is the same as Robinson's in one respect and different in another: both were fitted to insurance tables, but Miller used the 1983 tables where Robinson used the 1959 tables, and the two fits came out with different base weights and slopes. The fact that two careful fits to similar tables give different answers is itself a finding. It shows how much the result depends on which table and which fitting choice a researcher starts from, and it is one more reason to read the four figures as a spread rather than a single answer.
What is the Hamwi formula?
Hamwi is the oldest of the four. Dr. George Hamwi published it in 1964 for diabetes diet planning, in a chapter on changing dietary concepts. It was first written in pounds: 106 lb plus 6 lb for each inch over 5 ft for men, and 100 lb plus 5 lb for each inch over 5 ft for women. The metric form used by most calculators, and by this tool, is 48 kg plus 2.7 kg per inch for men and 45.5 kg plus 2.2 kg per inch for women. Those metric figures are rounded conversions of the pound figures, so a Hamwi figure worked out in pounds and converted exactly can differ from the metric form by about 0.3 kg. That small gap is a rounding difference between two ways of writing the same rule, not an error in either one.
Hamwi has the steepest male slope, at 2.7 kg per inch, and it is the only one of the four published with a frame correction: the traditional guidance adjusts the Hamwi figure down by about 10% for a small frame and up by about 10% for a large frame. Devine, Robinson and Miller carry no frame term of their own. For a woman 5 ft 7 in tall, Hamwi gives 60.9 kg, tied with Robinson. For a man of the same height it gives 66.9 kg, the highest of the four male figures, because its steep slope adds the most per inch.
Why do the four formulas give different answers?
The four formulas differ because they were built from different starting points. Hamwi came from clinical practice in diabetes care. Devine came from pharmacy practice and a mentor's working estimates. Robinson and Miller were fitted to insurance tables from different years. Each one starts from a different base weight at 5 ft and adds a different amount per inch, so the four lines cross each other as height changes. At 5 ft, the female figures run from 45.5 kg (Devine and Hamwi) to 53.1 kg (Miller), a spread of 7.6 kg before height has added anything at all. At 5 ft 7 in, the same four figures run from 60.9 kg to 62.6 kg, a spread of only 1.7 kg, because the gentler slopes have caught up with the higher base weights. At 6 ft, the spread opens again, from 69.4 kg to 73.1 kg.
The spread itself is the message. If four reasonable methods disagree by several kilograms for the same person, then no one of them can be the single correct weight for that person. The formulas also share a shape that limits them all: each one is a straight line, a base weight plus a fixed amount per inch. Real bodies do not follow a straight line so neatly. Weight relates to height through volume, which grows faster than height, and through muscle, bone and fat, which the formulas never measure. A straight-line rule can be a useful shorthand for dosing, where a stable reference number is needed, and it is a weak guide to a personal weight, where those missing factors matter most.
What does the quick-reference table show?
The table below is computed from the same formulas the tool uses, so every row can be checked by hand. It shows the four formula figures and the healthy BMI range for women at five heights, from 5 ft to 6 ft. The 5 ft 7 in row is the worked example from this article, so a reader can check the tool against the table before trusting it with another height.
| Height | Devine | Robinson | Miller | Hamwi | Healthy BMI range |
| 5 ft 0 in (152 cm) | 45.5 kg | 49.0 kg | 53.1 kg | 45.5 kg | 43.0–57.8 kg |
| 5 ft 4 in (163 cm) | 54.7 kg | 55.8 kg | 58.5 kg | 54.3 kg | 48.9–65.8 kg |
| 5 ft 7 in (170 cm) | 61.6 kg | 60.9 kg | 62.6 kg | 60.9 kg | 53.6–72.1 kg |
| 5 ft 10 in (178 cm) | 68.5 kg | 66.0 kg | 66.7 kg | 67.5 kg | 58.5–78.7 kg |
| 6 ft 0 in (183 cm) | 73.1 kg | 69.4 kg | 69.4 kg | 71.9 kg | 61.9–83.3 kg |
Two patterns in the table are worth reading closely. First, Miller gives the highest figure at the shorter heights and Devine gives the highest at the taller heights, because Miller starts high and rises slowly while Devine starts low and rises fast. Second, the healthy BMI range is wider than the spread of the four formulas at every height. At 5 ft 7 in, the formulas span 1.7 kg and the range spans 18.5 kg. The range is wider because it describes a band of weights linked to lower health risk across a population, while the formulas each pick one point inside or near that band. A weight inside the range and a weight equal to a formula figure are different kinds of statements, and the table keeps them in separate columns so they are not confused.
What is the difference between ideal weight and a healthy BMI range?
Ideal weight is a point estimate from a formula, and a healthy BMI range is a band from a ratio. BMI is weight in kilograms divided by height in metres squared. Turn the formula around, and weight equals BMI multiplied by height squared. Put 18.5 in for BMI and the result is the lower end of the healthy range. Put 24.9 in and the result is the upper end. For a height of 1.7018 m, that gives 53.6 kg at the lower end and 72.1 kg at the upper end. The BMI categories used by the CDC and the NHS place underweight below 18.5, healthy weight from 18.5 to 24.9, overweight from 25 to 29.9, and obesity at 30 and above.
The range has a different kind of support from the formulas. It comes from population studies that link BMI bands to health outcomes, rather than from insurance tables or dosing practice. That does not make it a personal prescription either. BMI cannot tell muscle from fat, so a muscular person can sit above the range while carrying little body fat, and a person with little muscle can sit inside the range while carrying more fat than the number suggests. The range is best read as a broad window for adults, and the formula figures as points inside or near that window. This page shows both because each one corrects the other: the formulas stop a reader from treating the whole 18.5 kg range as equally informative, and the range stops a reader from treating one formula figure as a target.
To work out your BMI number and category for your height and weight, use the BMI calculator.
How does frame size change the result?
Frame size is the size of a person's bone structure, and it shifts weight at the same height. A person with a large frame carries more bone and usually more muscle than a person of the same height with a small frame, so the same height can go with a higher weight without any difference in body fat. The traditional guidance, which comes from Hamwi, adjusts the figure by about 10% in either direction: down by about 10% for a small frame and up by about 10% for a large frame, with a medium frame left unchanged.
This tool does not ask for frame size, and that is a deliberate limit, not an oversight. Frame size is usually judged from wrist circumference or elbow breadth, and both need a careful measurement and a reference table to turn into a small, medium or large label. Guessing a frame size from a mirror would add a made-up adjustment to figures that are already estimates. A reader who knows their frame size can apply the 10% guide by hand: for the worked example, 10% of 61.6 kg is about 6.2 kg, so a small frame would sit near 55.4 kg and a large frame near 67.8 kg on the Devine figure. Those adjusted figures are still estimates, and they still sit inside the healthy BMI range of 53.6–72.1 kg. The adjustment shows how wide the honest uncertainty is once frame is taken into account, and it is one more reason not to chase a single number.
Who do these formulas not fit?
The formulas were built for adults, and they do not fit children or teenagers. Growth changes the link between height and weight year by year, so a child's weight is judged against BMI-for-age percentiles, not against an adult formula or an adult BMI band. They do not fit pregnancy either. Weight in pregnancy includes the baby, the placenta, amniotic fluid and increased blood volume, and the healthy amount of weight gain depends on the starting BMI and the stage of pregnancy, which no height-and-sex formula can capture. Athletes are another poor fit. Muscle is denser than fat, so a trained person can weigh more than the formulas suggest while carrying little body fat. The formulas know nothing about muscle, so they will call that extra muscle excess weight. Older adults are a poor fit in the other direction. Muscle is often lost with age while fat is kept or gained, so an older person can sit inside the formula range while carrying more fat and less muscle than the number implies. People with an amputation, a spinal condition that changes measured height, or a condition that changes fluid balance will also get a misleading figure, because the formulas assume a standard adult body with two legs and a height that can be measured standing.
To estimate lean mass and body fat from your weight, height and body fat percentage, use the FFMI calculator.
What mistakes do people commonly make with ideal weight?
The first mistake is picking one formula and treating its figure as a target. The worked example shows why that fails: Devine says 61.6 kg, Miller says 62.6 kg, and both are defensible readings of the same height. Aiming at one of them and missing the other by a kilogram means nothing, because the gap between them is smaller than the error in most bathroom scales, most height measurements, and most day-to-day weight changes from food, water and clothing.
The second mistake is mixing up the formula figures with the healthy range. A weight of 70 kg for a woman 5 ft 7 in tall is above every formula figure in the worked example and still inside the healthy BMI range, which runs to 72.1 kg. A weight of 55 kg is below every formula figure and still inside the range. Neither position is proved right or wrong by the formulas alone. The range and the formulas answer different questions, and a reader who uses one to judge the other will draw a sharper conclusion than the numbers support.
The third mistake is entering height wrong. The most common form is mixing units: entering 170 in the feet field, or entering 5.7 in a single height field and meaning 5 ft 7 in. The figure 5.7 as a decimal means 5 feet plus 0.7 of a foot, which is 5 ft 8.4 in, not 5 ft 7 in. This tool splits feet and inches into separate fields so that error cannot happen in the entry itself, but it can still happen when a height is copied from a record that uses decimals. Convert the decimal part by multiplying by 12 before entering it, and check that the inches part is below 12.
The fourth mistake is treating a formula figure as medical advice. These figures describe populations and clinical conventions, and they say nothing about a person's diet, activity, medical history or body composition. A figure that looks high or low on this page is not a diagnosis, and it is not a reason to change eating or exercise habits on its own. Anyone who wants a personal weight goal should speak to a clinician or a registered dietitian, who can weigh the other factors the formulas leave out.
What information does this tool store?
This tool works from the height and sex typed into it on the page. It does not ask for a name, an email address, or any account detail, and the article itself carries no personal information. A reader who wants to keep a result can note it down separately. The tool does not need any personal detail to produce the four formula figures or the healthy range. The results are shown on the page in the labelled boxes above, and the worked examples in this article use only the verified test figures listed at the end, so a reader can check the tool against a known answer before trusting it with a real height.
For more tools in the same collection, browse the calculators category.
Frequently asked questions
FAQ 1 — What is the ideal weight for a 5'7" female?
For a woman 5 ft 7 in tall, the four formulas give Devine 61.6 kg (135.8 lb), Robinson 60.9 kg (134.3 lb), Miller 62.6 kg (138.1 lb) and Hamwi 60.9 kg (134.3 lb). The healthy BMI weight range for that height is 53.6–72.1 kg (118.1–159.0 lb). No single figure is a target; the four figures and the range together are the answer.
FAQ 2 — How is ideal weight calculated?
Each formula starts from a base weight at 5 ft and adds a fixed amount for each inch over 5 ft. For women, Devine is 45.5 kg plus 2.3 kg per inch, Robinson is 49 kg plus 1.7 kg per inch, Miller is 53.1 kg plus 1.36 kg per inch, and Hamwi is 45.5 kg plus 2.2 kg per inch. For a woman 5 ft 7 in tall, that is 7 inches over 5 ft, so Devine is 45.5 plus 16.1, which is 61.6 kg.
FAQ 3 — What is the healthy weight range for a 5'7" female?
The healthy weight range for a woman 5 ft 7 in tall is 53.6–72.1 kg (118.1–159.0 lb). It comes from the healthy BMI range of 18.5 to 24.9: weight equals BMI multiplied by height in metres squared, and 5 ft 7 in is 1.7018 m. The same range applies to a man of the same height, because the BMI range depends on height alone.
FAQ 4 — Which ideal weight formula is most accurate?
No one formula is the most accurate for a person, because they were built for different purposes. Devine was published for drug dosing, Hamwi for diabetes diet planning, and Robinson and Miller were fitted to old insurance tables. They disagree by several kilograms for the same person, so the spread between them is a better guide than any single figure, and the healthy BMI range is the better reference for general health.
FAQ 5 — How is this different from the BMI Calculator?
The BMI Calculator gives a BMI number, a category, and the BMI-based healthy range. It does not give the Devine, Robinson, Miller or Hamwi figures. This page gives all four formula figures plus the healthy range, so a reader can see the formula estimates and the range side by side instead of only the range.
FAQ 6 — Does ideal weight change with age or muscle?
The formulas do not change with age or muscle, because they use only height and sex. Age, muscle, frame size and body composition all change what weight goes with a height, which is why the formulas do not fit athletes, older adults, children or pregnancy well. A clinician or a registered dietitian can take those factors into account; this tool cannot.
What is the ideal weight for a 5'7" female?
For a woman 5 ft 7 in tall, the four formulas give Devine 61.6 kg (135.8 lb), Robinson 60.9 kg (134.3 lb), Miller 62.6 kg (138.1 lb) and Hamwi 60.9 kg (134.3 lb). The healthy BMI weight range for that height is 53.6–72.1 kg (118.1–159.0 lb). No single figure is a target; the four figures and the range together are the answer.
How is ideal weight calculated?
Each formula starts from a base weight at 5 ft and adds a fixed amount for each inch over 5 ft. For women, Devine is 45.5 kg plus 2.3 kg per inch, Robinson is 49 kg plus 1.7 kg per inch, Miller is 53.1 kg plus 1.36 kg per inch, and Hamwi is 45.5 kg plus 2.2 kg per inch. For a woman 5 ft 7 in tall, that is 7 inches over 5 ft, so Devine is 45.5 plus 16.1, which is 61.6 kg.
What is the healthy weight range for a 5'7" female?
The healthy weight range for a woman 5 ft 7 in tall is 53.6–72.1 kg (118.1–159.0 lb). It comes from the healthy BMI range of 18.5 to 24.9: weight equals BMI multiplied by height in metres squared, and 5 ft 7 in is 1.7018 m. The same range applies to a man of the same height, because the BMI range depends on height alone.
Which ideal weight formula is most accurate?
No one formula is the most accurate for a person, because they were built for different purposes. Devine was published for drug dosing, Hamwi for diabetes diet planning, and Robinson and Miller were fitted to old insurance tables. They disagree by several kilograms for the same person, so the spread between them is a better guide than any single figure, and the healthy BMI range is the better reference for general health.
How is this different from the BMI Calculator?
The BMI Calculator gives a BMI number, a category, and the BMI-based healthy range. It does not give the Devine, Robinson, Miller or Hamwi figures. This page gives all four formula figures plus the healthy range, so a reader can see the formula estimates and the range side by side instead of only the range.
Does ideal weight change with age or muscle?
The formulas do not change with age or muscle, because they use only height and sex. Age, muscle, frame size and body composition all change what weight goes with a height, which is why the formulas do not fit athletes, older adults, children or pregnancy well. A clinician or a registered dietitian can take those factors into account; this tool cannot.