
WHP to HP Conversion
Section A — Wheel horsepower (WHP) to crank horsepower (HP)
Enter a wheel horsepower figure from a dyno run and a drivetrain loss percentage to estimate the crank horsepower.
Or enter your own loss percentage in the field above. The preset buttons only fill in the field; you can change the number afterwards.
Section B — Crank horsepower (HP) to wheel horsepower (WHP)
Enter a crank horsepower figure and a drivetrain loss percentage to estimate the wheel horsepower.
Or enter your own loss percentage in the field above. The preset buttons only fill in the field; you can change the number afterwards.
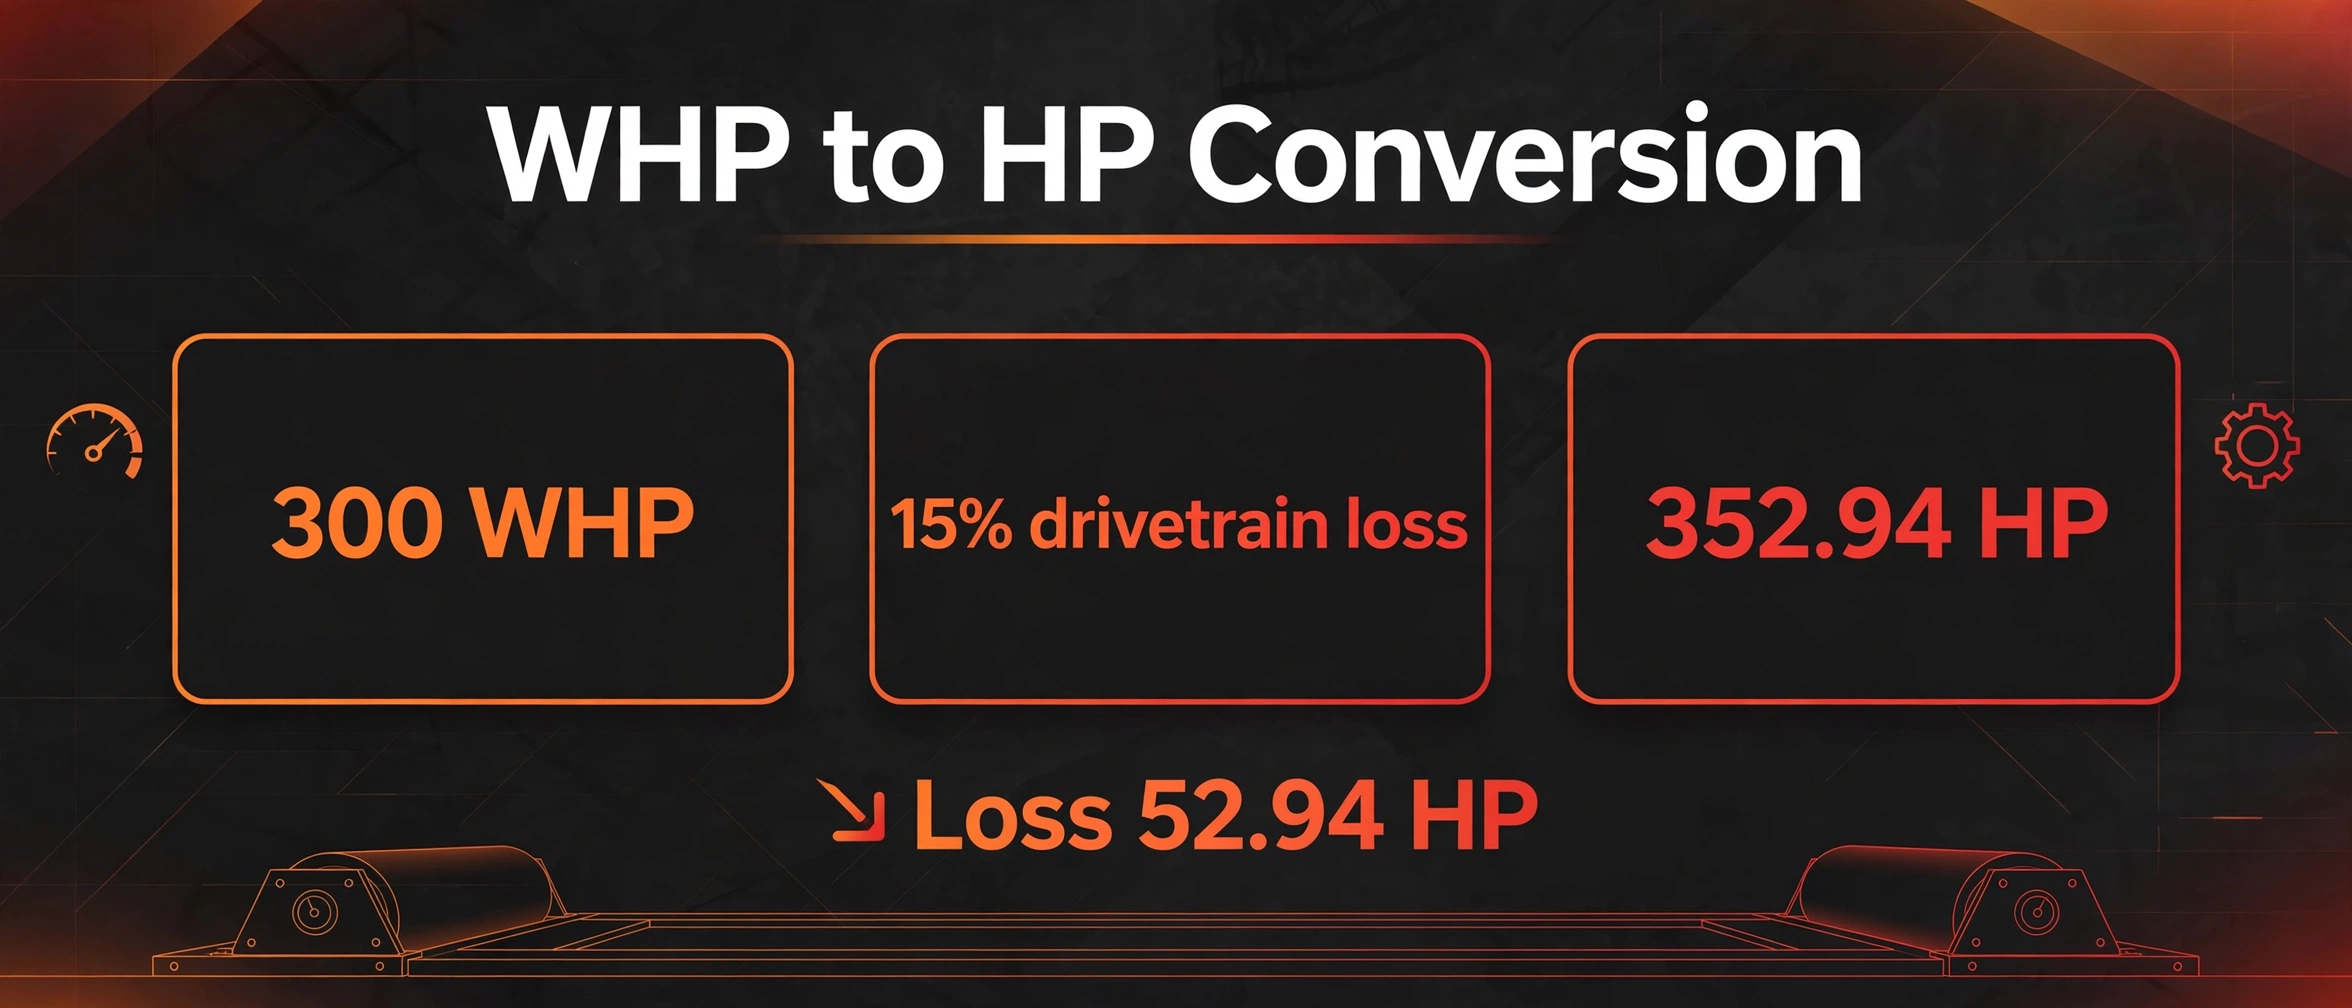
A WHP to HP conversion estimates crank horsepower from a wheel horsepower figure by adding back the power lost in the drivetrain. If a car puts down 300 WHP on a dyno and loses about 15% through the drivetrain, its crank horsepower is about 352.94 HP.
How do I use the WHP to HP Conversion tool?
Use Section A when you have a wheel horsepower figure, usually from a chassis dyno run, and you want to estimate the crank horsepower. Enter the WHP value, then enter a drivetrain loss percentage. Press one of the preset buttons to fill in a typical loss — FWD 10%, RWD 15%, or AWD 20% — or type your own percentage into the field. Press the calculate button and the result boxes show the estimated crank horsepower, the power lost in the drivetrain in HP, and the crank horsepower in kW.
Use Section B when you have a crank horsepower figure, usually a manufacturer’s quoted output, and you want to estimate the wheel horsepower. Enter the crank HP, then enter a drivetrain loss percentage using the same presets or your own figure. Press the calculate button and the result boxes show the estimated wheel horsepower, the power lost in the drivetrain in HP, and the wheel horsepower in kW.
The two sections do not depend on each other. Use only the direction you need. The result is an estimate in both directions, because the loss percentage is an estimate. A loss of 15% is a typical figure for a rear-wheel-drive car, not a measurement of that car. If you have a measured WHP and a measured crank HP for the same car, you can work out its actual loss percentage with the formula given later in this article, and then use that figure instead of a preset.
A worked example from the live tool
Start with Section A and the first verified test. Enter 300 WHP and a drivetrain loss of 15%. The tool first turns the percentage into a decimal: 15 divided by 100 is 0.15. It then subtracts that from 1: 1 minus 0.15 is 0.85, which is the fraction of the crank power that reaches the wheels. Finally it divides the WHP by that fraction: 300 divided by 0.85 is 352.9411, which rounds to 352.94 HP. That is the estimated crank horsepower.
The power lost in the drivetrain is the difference between the two figures: 352.94 minus 300 is 52.94 HP. In other words, about 52.94 HP of the engine’s output never reaches the wheels; it is absorbed on the way through the gearbox, the driveshaft, the differential, and the tyres. The kW figure follows from the standard conversion of 1 HP = 0.7457 kW: 352.94 multiplied by 0.7457 is 263.19 kW.
A second test changes both the power and the drivetrain. Enter 250 WHP with a loss of 10%, the FWD preset. The fraction reaching the wheels is 1 minus 0.10, which is 0.90. Divide 250 by 0.90 and the result is 277.7777, which rounds to 277.78 HP. The loss is 277.78 minus 250, which is 27.78 HP, and the kW figure is 277.78 multiplied by 0.7457, which is 207.14 kW.
Now use Section B with the third verified test. Enter 400 crank HP with a loss of 20%, the AWD preset. This direction multiplies instead of dividing: 400 multiplied by (1 minus 0.20), which is 0.80, gives 320.00 WHP. The loss is 400 minus 320, which is 80.00 HP, and the kW figure is 320 multiplied by 0.7457, which is 238.62 kW. A fourth test uses an unusually high loss to show the formula at work: 200 WHP at 25% loss gives 200 divided by 0.75, which is 266.6666, rounding to 266.67 HP, with a loss of 66.67 HP and 198.85 kW. The pattern is the same in every case: a larger loss percentage always gives a larger gap between WHP and crank HP.
What is wheel horsepower (WHP)?
Wheel horsepower is the power measured at the drive wheels, usually on a chassis dynamometer, commonly called a dyno. The car is driven onto rollers, or its wheels are replaced by hub-mounted dyno units, and the dyno measures how much power the wheels deliver under load. WHP is the power that actually moves the car, after every loss between the engine and the road has taken its share.
WHP is the figure that matters most for how a car accelerates in the real world, because it is the power left after the drivetrain has taken its cut. Two cars with the same crank horsepower can have different WHP if one has a more efficient drivetrain than the other. A front-wheel-drive car with a short power path will typically put more of its crank power to the wheels than an all-wheel-drive car with extra differentials and driveshafts, even if both engines produce the same crank figure.
WHP is also the figure a tuner measures after a modification. A new exhaust, a remap, or a turbo upgrade is usually tested on a chassis dyno, so the before-and-after numbers are WHP figures. Comparing a WHP figure from a dyno run with a crank HP figure from a brochure is a comparison of two different measurements, and that is where most confusion about WHP and HP begins.
What is crank horsepower (HP)?
Crank horsepower, also called engine horsepower or brake horsepower (bhp), is the power produced by the engine at its crankshaft, before the drivetrain takes any of it. It is the figure manufacturers usually quote, because it is measured on an engine dyno with the engine removed from the car and run on a test stand, without a gearbox, driveshaft, differential, or wheels attached.
Because crank HP is measured before the drivetrain, it is always higher than WHP for the same car. The gap between the two is the drivetrain loss. A car quoted at 400 HP by its manufacturer will not put 400 HP to the wheels. With a 20% drivetrain loss, it will put about 320 WHP to the wheels, as the third verified test above shows. The 80 HP difference is not missing power or a fault in the engine. It is the cost of getting the power from the crankshaft to the road.
Crank HP is measured under controlled conditions on an engine test stand, with standardised correction factors applied for temperature, pressure, and humidity. The most commonly cited standard is SAE J1349, which corrects the measured output to a standard set of atmospheric conditions so that figures from different days and different test stands can be compared. A manufacturer’s quoted figure is therefore a corrected crank figure, not a raw reading, and not a wheel figure.
For electrical power units such as watts and kilowatts, see the electrical unit converter.
How do you convert WHP to HP?
The formula for converting wheel horsepower to crank horsepower is HP = WHP ÷ (1 − drivetrain loss), where the drivetrain loss is written as a decimal. A loss of 15% becomes 0.15, so the formula becomes HP = WHP ÷ (1 − 0.15), which is HP = WHP ÷ 0.85. The division is the key step. Dividing by a number smaller than 1 gives a larger result, which is correct: crank HP is always larger than WHP, so the answer must come out bigger than the number entered.
The reverse formula is WHP = HP × (1 − drivetrain loss). A crank figure of 400 HP with a 20% loss gives WHP = 400 × 0.80, which is 320.00 WHP. Multiplication by a number smaller than 1 gives a smaller result, which is also correct: WHP is always smaller than crank HP.
If both figures are known for the same car, the actual loss percentage can be worked out directly: drivetrain loss % = ((HP − WHP) ÷ HP) × 100. A car with 300 crank HP and 255 WHP has a loss of (300 − 255) ÷ 300 × 100, which is 15.00%. That measured loss is more useful than any preset, because it belongs to that car rather than to a drivetrain type in general. The presets in this tool are starting points for when no measured loss exists.
Where does the lost power go?
The power lost between the crankshaft and the wheels is absorbed by the parts that carry it, and each part takes a share. The gearbox is the first and usually the largest share. Gears mesh under load, oil is churned and sheared inside the casing, and bearings and seals add friction. An automatic transmission generally loses more than a manual one, because its torque converter and hydraulic pump add their own losses on top of the gear friction.
The driveshaft and the differential take the next share. A rear-wheel-drive car sends power along a propshaft to a separate rear differential, and the change of direction inside the differential — from a shaft running along the car to axles running across it — costs power through gear friction and oil churning. A front-wheel-drive car combines the gearbox and differential into one transaxle unit close to the engine, which shortens the power path and is one reason FWD losses are typically lower.
The remaining shares are smaller but real. Constant-velocity joints and axle shafts flex and rotate under load. Wheel bearings and seals add friction. Tyres deform as they roll, and that deformation, called rolling resistance, turns some power into heat. Accessories driven by the engine, such as the alternator, the water pump, and the air-conditioning compressor, also draw power before it reaches the wheels, although whether they count as drivetrain loss depends on how the crank figure was measured. The total loss is the sum of all these small shares, which is why it is quoted as a percentage rather than a fixed number of horsepower: a more powerful engine pushes more power through the same parts, so more power is lost in absolute terms even when the percentage stays similar.
How much power does each drivetrain type lose?
The loss percentages used in this tool are the values most commonly cited across calculator and automotive sources, and they are estimates, not measurements. Front-wheel drive typically loses about 8–12%, with 10% used as the preset. Rear-wheel drive typically loses about 12–18%, with 15% used as the preset. All-wheel drive typically loses about 18–22%, with 20% used as the preset. Part-time and full-time four-wheel-drive systems, which add a transfer case and often a low-range gear set, typically lose about 22–28%, with 25% as a reasonable custom figure.
| Drivetrain layout | Typical loss range | Preset in this tool | Example: 300 crank HP → WHP |
| Front-wheel drive (FWD) | 8–12% | 10% | 270.00 WHP |
| Rear-wheel drive (RWD) | 12–18% | 15% | 255.00 WHP |
| All-wheel drive (AWD) | 18–22% | 20% | 240.00 WHP |
| Four-wheel drive (4WD) | 22–28% | 25% | 225.00 WHP |
Each row follows the same multiplication: 300 × (1 − loss). For FWD at 10%, 300 × 0.90 is 270.00 WHP. For RWD at 15%, 300 × 0.85 is 255.00 WHP. For AWD at 20%, 300 × 0.80 is 240.00 WHP. For 4WD at 25%, 300 × 0.75 is 225.00 WHP. The same 300 HP engine therefore puts between 225 and 270 WHP to the wheels depending on the drivetrain alone.
Different sources quote slightly different ranges for the same layout. Some list FWD at 15% and RWD at 18–20%, and some list AWD as high as 25%. That spread is not a mistake in any one source. It reflects real differences between cars: a manual gearbox loses less than an automatic, a modern dual-clutch gearbox loses less than an older torque-converter automatic, a worn differential loses more than a fresh one, and a car with heavy, wide tyres loses more to rolling resistance than the same car on narrow tyres. The ranges above are the middle ground across sources, and the custom loss field exists so that a measured figure, or a figure from a trusted source for a specific car, can replace a preset.
What is a chassis dyno, and why do dyno figures vary?
A chassis dyno measures WHP by loading the drive wheels. The most common type is an inertia dyno, where the car’s wheels spin a heavy roller and the dyno works out power from how quickly the roller accelerates. The other common type is a load-bearing dyno, where the roller or hub unit applies a controlled resistance and measures the force directly. Hub dynos bolt onto the wheel hubs in place of the wheels, which removes tyre slip and tyre deformation from the measurement and usually gives a slightly higher figure than a roller dyno for the same car.
The same car can give different WHP figures on different dynos, and even on the same dyno on different days. The correction factor is one reason. Dyno software corrects the raw reading to a standard set of atmospheric conditions, because an engine makes less power in hot, thin air than in cold, dense air. The SAE J1349 standard is the most widely used correction, but some dynos use other standards, and a figure corrected to one standard will not match the same run corrected to another. The difference between two correction standards is usually a few percent, which is enough to move a 300 WHP reading by several horsepower.
Conditions and setup add more variation. Tyre pressure changes rolling resistance. The gear used for the run changes the result, because different gears put different loads on the drivetrain. Strap tension on a roller dyno, the temperature of the gearbox oil, the temperature of the engine, and even the fan blowing air at the car all shift the reading. A dyno figure is therefore best read as an estimate within a few percent, not as an exact measurement to the horsepower. Two runs of the same car back to back on the same dyno should agree closely, but two runs on different dynos on different days may not, and neither one is necessarily wrong.
Why can two cars with the same WHP feel different?
Two cars with the same WHP can accelerate differently, because WHP is a peak figure and acceleration depends on much more than a peak. The shape of the power curve matters: an engine that makes its power across a wide rev range will feel stronger than an engine that makes the same peak power only in a narrow band near the red line. A turbocharged engine and a naturally aspirated engine can share a WHP figure and still behave very differently on the road, because one delivers its power early and the other only at high revs.
Weight is the second reason. A lighter car with 300 WHP will accelerate faster than a heavier car with the same 300 WHP, because the same power is moving less mass. That is why power-to-weight ratio, usually written as HP per tonne, is a better guide to acceleration than WHP alone. A 300 WHP car weighing 1,200 kg has 250 WHP per tonne. A 300 WHP car weighing 1,800 kg has about 167 WHP per tonne. The heavier car needs a much larger WHP figure to match the lighter one’s acceleration.
Gearing and traction are the third reason. Shorter gearing multiplies torque at the wheels and can make a car feel quicker even with the same WHP. Tyres and drivetrain layout decide how much of that WHP can actually be used at launch: a front-wheel-drive car can struggle for grip with high WHP, while an all-wheel-drive car can put the same power down more cleanly. WHP answers the question of how much power reaches the wheels. It does not answer the question of how quickly that power becomes speed, and that second question depends on weight, gearing, tyres, and the shape of the power curve.
For the general time, distance, and speed relationship, which matters when WHP is used to estimate acceleration, see the time distance speed calculator.
What mistakes do people commonly make with WHP and HP?
The first mistake is adding a fixed number of horsepower instead of a percentage. A reader who knows that a car loses “about 50 HP” through the drivetrain and adds 50 HP to a 300 WHP figure gets 350 HP, which is close to the correct 352.94 HP at 15% loss. But the same fixed 50 HP added to a 200 WHP figure gives 250 HP, while the correct figure at 15% loss is 235.29 HP. The error grows as the power changes, because drivetrain loss scales with power. Always use the percentage form of the formula, not a fixed number.
The second mistake is using the wrong direction of the formula. Dividing WHP by (1 − loss) gives crank HP. Multiplying WHP by (1 − loss) gives a smaller number, which is wrong for that direction — it would give 255 WHP from 300 WHP at 15% loss, which is a wheel figure from a wheel figure. The reverse mistake is dividing a crank figure by (1 − loss), which inflates it. A 400 HP crank figure divided by 0.80 gives 500 HP, which is not a real figure at all. The rule is simple: going from wheels to crank, divide; going from crank to wheels, multiply.
The third mistake is confusing bhp, PS, and kW. Brake horsepower (bhp) and crank HP are the same measurement in this article: power at the crankshaft. PS, short for Pferdestärke, is the metric horsepower used in many European and Japanese specifications. One PS is 0.7355 kW, while one mechanical HP is 0.7457 kW, so 1 HP is about 1.0139 PS. The difference is small — a car quoted at 300 PS makes about 295.9 HP — but it is enough to matter when a dyno figure in HP is compared with a brochure figure in PS. Check the unit before comparing two numbers, and convert with the kW figures the tool shows if the units differ.
The fourth mistake is treating a manufacturer’s crank figure and a dyno WHP figure as if they were measured the same way. The crank figure comes from an engine test stand under corrected conditions. The WHP figure comes from a chassis dyno under the conditions of the day, with that dyno’s correction factor and that car’s tyres, gearing, and drivetrain condition. A gap larger than the typical loss range does not necessarily mean the engine is underperforming. It can mean the dyno, the correction, or the conditions differ from the manufacturer’s test. Before drawing a conclusion from a gap, check the correction standard, the gear used, and whether the loss percentage used is a measured figure or a preset.
For other unit changes on the same page, see the unit converter for converting between kW, HP, and other units.
What are the limits of a WHP to HP conversion?
A WHP to HP conversion is an estimate, and its accuracy is limited by the loss percentage. The formula itself is exact arithmetic, but the loss figure is not. If the true loss for a car is 18% and a 15% preset is used, a 300 WHP figure converts to 352.94 HP, while the true crank figure would be 300 divided by 0.82, which is 365.85 HP. A 3-point error in the loss percentage produces a 13 HP error in the answer. The conversion is only as good as the loss figure, so a measured loss for the specific car is always better than a preset.
The conversion also assumes the loss is a fixed percentage at all power levels, which is a simplification. In reality, some losses are roughly fixed — the power needed to turn the gearbox oil pump, for example, does not grow in proportion to engine output — while others grow with power. That means the true loss percentage can change with the power level, and a percentage measured at 200 WHP may not hold exactly at 400 WHP. For the power range of most road cars, the fixed-percentage assumption is close enough to be useful, but it is still an assumption.
The tool also takes the WHP figure at face value. If the dyno figure was measured with a different correction factor than the crank figure it is being compared with, the conversion will carry that difference through. A WHP figure from a hub dyno and a WHP figure from a roller dyno are not the same measurement either, and converting both with the same loss percentage will give different crank estimates. Use the conversion to compare figures measured the same way, or to get a realistic range by trying the low and high ends of the loss range for the drivetrain type.
What does the quick-reference table show?
The table below is computed from the same formulas the tool uses, at a 15% drivetrain loss, so every row can be checked by hand. It shows four WHP figures and the crank HP each one converts to, together with the power lost. It is a quick way to sense-check a result: if the tool gives a crank figure far from the row for the same WHP at 15% loss, the loss percentage entered was probably different from 15%.
| WHP | Crank HP at 15% loss | Power lost |
| 200 WHP | 235.29 HP | 35.29 HP |
| 250 WHP | 294.12 HP | 44.12 HP |
| 300 WHP | 352.94 HP | 52.94 HP |
| 350 WHP | 411.76 HP | 61.76 HP |
Each row follows the same division: WHP divided by 0.85. For 200 WHP, 200 divided by 0.85 is 235.2941, which rounds to 235.29 HP, and the loss is 235.29 minus 200, which is 35.29 HP. For 250 WHP, 250 divided by 0.85 is 294.1176, which rounds to 294.12 HP, and the loss is 44.12 HP. For 300 WHP, 300 divided by 0.85 is 352.9411, which rounds to 352.94 HP, and the loss is 52.94 HP. For 350 WHP, 350 divided by 0.85 is 411.7647, which rounds to 411.76 HP, and the loss is 61.76 HP. The table covers only 15% loss because that is the most commonly used preset; Section A of the tool extends the same arithmetic to any loss percentage entered.
What information does this tool store?
This tool works from the numbers typed into it on the page. It does not ask for a name, an email address, or any account detail, and the article itself carries no personal information. A reader who wants to keep a result can note it down separately; the tool does not need any personal detail to produce a crank horsepower or a wheel horsepower figure. The results are shown on the page in the labelled boxes above, and the worked examples in this article use only the verified test figures listed at the end, so a reader can check the tool against a known answer before trusting it with a real dyno figure.
For more tools in the same collection, browse the converters category.
Frequently asked questions
FAQ 1 — How do I convert WHP to HP?
Divide the WHP by (1 − drivetrain loss as a decimal). For 300 WHP at 15% loss, divide 300 by 0.85 to get 352.94 HP. Section A of the tool does this division, and also shows the 52.94 HP lost in the drivetrain and 263.19 kW.
FAQ 2 — How do I convert HP to WHP?
Multiply the crank HP by (1 − drivetrain loss as a decimal). For 400 crank HP at 20% loss, multiply 400 by 0.80 to get 320.00 WHP. Section B of the tool does this multiplication, and also shows the 80.00 HP lost in the drivetrain and 238.62 kW.
FAQ 3 — How much power is lost through the drivetrain?
Typical losses are about 8–12% for front-wheel drive, 12–18% for rear-wheel drive, 18–22% for all-wheel drive, and 22–28% for four-wheel drive. These are estimates, not fixed constants, and the actual loss depends on the transmission type, the condition of the parts, the tyres, and the power level.
FAQ 4 — Is WHP the same as HP?
No. HP, or crank horsepower, is the power produced by the engine at its crankshaft, before the drivetrain takes any of it. WHP is the power measured at the drive wheels after drivetrain losses. WHP is always lower than crank HP for the same car.
FAQ 5 — Why does my dyno WHP not match the manufacturer’s HP figure?
The manufacturer’s figure is a crank horsepower figure measured on an engine test stand under corrected conditions. A dyno measures wheel horsepower, after drivetrain losses of roughly 10–25%. The two figures are measured in different places, so a gap is expected. Dyno type, correction factor, gear used, and conditions also shift the reading.
FAQ 6 — Can I use a custom drivetrain loss percentage?
Yes. The preset buttons fill in 10% for FWD, 15% for RWD, and 20% for AWD, but you can type any loss percentage into the field, including a measured loss for your own car. The loss must be less than 100%, because a loss of 100% would mean no power reaches the wheels.
How do I convert WHP to HP?
Divide the WHP by (1 − drivetrain loss as a decimal). For 300 WHP at 15% loss, divide 300 by 0.85 to get 352.94 HP. Section A of the tool does this division, and also shows the 52.94 HP lost in the drivetrain and 263.19 kW.
How do I convert HP to WHP?
Multiply the crank HP by (1 − drivetrain loss as a decimal). For 400 crank HP at 20% loss, multiply 400 by 0.80 to get 320.00 WHP. Section B of the tool does this multiplication, and also shows the 80.00 HP lost in the drivetrain and 238.62 kW.
How much power is lost through the drivetrain?
Typical losses are about 8–12% for front-wheel drive, 12–18% for rear-wheel drive, 18–22% for all-wheel drive, and 22–28% for four-wheel drive. These are estimates, not fixed constants, and the actual loss depends on the transmission type, the condition of the parts, the tyres, and the power level.
Is WHP the same as HP?
No. HP, or crank horsepower, is the power produced by the engine at its crankshaft, before the drivetrain takes any of it. WHP is the power measured at the drive wheels after drivetrain losses. WHP is always lower than crank HP for the same car.
Why does my dyno WHP not match the manufacturer’s HP figure?
The manufacturer’s figure is a crank horsepower figure measured on an engine test stand under corrected conditions. A dyno measures wheel horsepower, after drivetrain losses of roughly 10–25%. The two figures are measured in different places, so a gap is expected. Dyno type, correction factor, gear used, and conditions also shift the reading.
Can I use a custom drivetrain loss percentage?
Yes. The preset buttons fill in 10% for FWD, 15% for RWD, and 20% for AWD, but you can type any loss percentage into the field, including a measured loss for your own car. The loss must be less than 100%, because a loss of 100% would mean no power reaches the wheels.