
Debt to Income Calculator
Enter your gross monthly income and each monthly debt payment. Leave a debt field blank or enter 0 if it does not apply to you.
Use the minimum payment for credit cards, not the balance. Put any other recurring debt payment, such as a personal loan, child support, or alimony, in “Other monthly debts”.
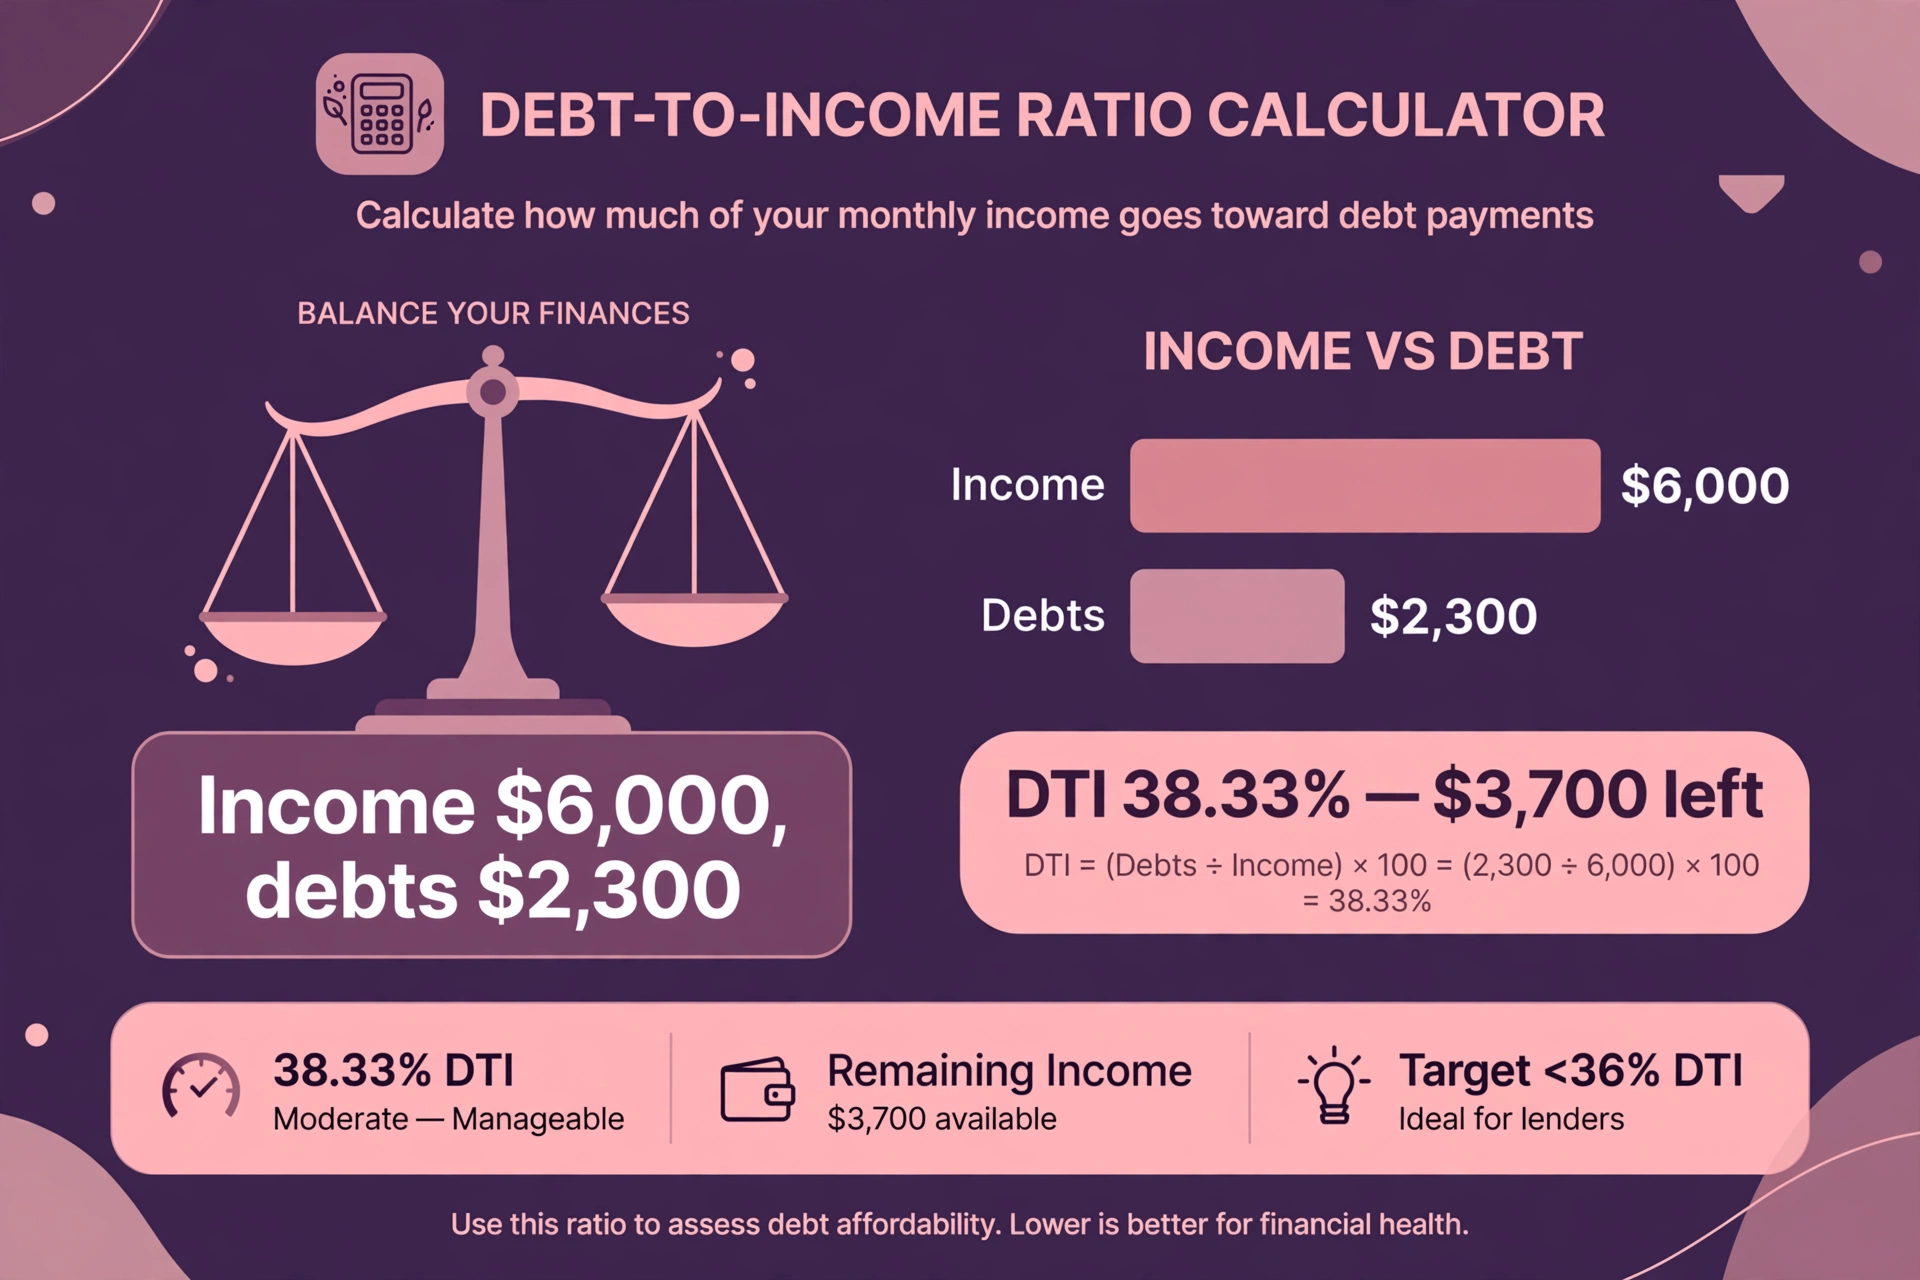
Your debt to income ratio (DTI) is your total monthly debt payments divided by your gross monthly income, expressed as a percentage. If you pay 2,300 a month in debts and earn 6,000 a month before tax, your DTI is 38.33%.
How do I use the Debt to Income Calculator?
Enter your gross monthly income first. That is your income before tax and other deductions are taken out, not the amount that lands in your bank account. If you are paid a salary, divide your annual salary by 12. If you are paid hourly, multiply your hourly rate by your typical weekly hours, multiply that by 52, and divide by 12. If you are paid every two weeks, multiply one gross paycheck by 26 and divide by 12, which accounts for the two extra paychecks a biweekly schedule produces each year.
Then enter each monthly debt payment in its own field. Housing is your rent or mortgage payment for the month. Car loan is your monthly car payment. Student loan is your monthly student loan payment. Credit card minimums is the total of the minimum payments on your cards, not the balances. Other monthly debts covers anything else that is a recurring debt payment, such as a personal loan, child support, or alimony. Leave a field blank or enter 0 if that debt does not apply to you.
To work out the monthly payment on a loan before entering it as a debt here, see the loan calculator.
To work out a car loan payment and its interest before entering it as a debt here, see the car payment interest calculator.
To work out a monthly EMI with a full repayment schedule before entering it as a debt here, see the EMI calculator.
Press the calculate button and five result boxes appear. Total monthly debt is the sum of all five debt fields. Back-end DTI is that total divided by your gross monthly income, multiplied by 100. Front-end DTI is the housing figure alone divided by your gross monthly income, multiplied by 100. Remaining income after debts is your gross monthly income minus your total monthly debt. The last box gives a plain-language reading of the back-end ratio against the figures most often cited as general guideposts: under 36%, between 36% and 43%, or over 43%. Those guideposts are described in full later in this article, and they are not lending rules. Limits vary by lender and loan type, and this tool does not approve or refuse a loan.
What does a worked example from the live tool show?
Start with the first verified test. Enter a gross monthly income of 6,000, housing of 1,500, a car loan of 350, a student loan of 200, credit card minimums of 150, and other debts of 100. The tool first adds the debts: 1,500 plus 350 is 1,850, plus 200 is 2,050, plus 150 is 2,200, plus 100 is 2,300. Total monthly debt is 2,300.
The back-end DTI divides that total by the income and multiplies by 100: 2,300 divided by 6,000 is 0.383333, and multiplied by 100 it is 38.33%. The front-end DTI uses only the housing figure: 1,500 divided by 6,000 is 0.25, and multiplied by 100 it is 25.00%. Remaining income is 6,000 minus 2,300, which is 3,700. The reading box says the back-end ratio sits between 36% and 43%, between two figures often cited as general guideposts.
A second test changes the shape of the debts. Enter an income of 4,000, housing of 1,200, a car loan of 0, a student loan of 0, credit card minimums of 100, and other debts of 0. Total monthly debt is 1,300. The back-end DTI is 1,300 divided by 4,000, multiplied by 100, which is 32.50%. The front-end DTI is 1,200 divided by 4,000, multiplied by 100, which is 30.00%. Remaining income is 4,000 minus 1,300, which is 2,700. The reading box says the back-end ratio sits under 36%. Notice that the front-end ratio here, 30.00%, is higher than in the first test, 25.00%, even though the back-end ratio is lower. Housing takes a bigger share of a smaller income, while the total debt is smaller because there is no car or student loan. The two ratios answer different questions, and one can move while the other stays still.
A third test shows a higher ratio. Enter an income of 8,000, housing of 2,500, a car loan of 500, a student loan of 400, credit card minimums of 300, and other debts of 200. Total monthly debt is 3,900. The back-end DTI is 3,900 divided by 8,000, multiplied by 100, which is 48.75%. The front-end DTI is 2,500 divided by 8,000, multiplied by 100, which is 31.25%. Remaining income is 8,000 minus 3,900, which is 4,100. The reading box says the back-end ratio sits over 43%. The remaining income, 4,100, is still the largest of the three tests in cash terms, which shows why a percentage alone does not tell the whole story: 48.75% of a large income can leave more cash than 32.50% of a small one.
The tool also handles missing or zero income. If the income field is left blank, it shows “Please enter your gross monthly income.” and no results. If the income entered is 0, it shows “Gross monthly income must be greater than 0.” and no results. A negative figure in any debt field shows “A debt payment cannot be negative.” and no results. Those are the only error cases in this tool, and they are there because a ratio with no income, or with a negative payment, has no meaning.
What is a debt to income ratio?
A debt to income ratio is the share of your gross monthly income that goes to monthly debt payments, expressed as a percentage. The Consumer Financial Protection Bureau (CFPB) defines it the same way: DTI is all your monthly debt payments divided by your gross monthly income, and it is one way lenders measure your ability to manage the monthly payments on money you plan to borrow. The CFPB’s page on the subject is “What is a debt-to-income ratio?” at consumerfinance.gov.
The ratio has two numbers in it, and both matter. The numerator is the total of your monthly debt payments. The denominator is your gross monthly income, which is your income before taxes and other deductions are taken out. Because the denominator is gross income, the ratio usually looks smaller than it feels against take-home pay. A ratio of 38.33% means 38.33 cents of each dollar earned before tax goes to debt. After tax, the share of what actually arrives in your account is higher, because the denominator shrinks while the numerator stays the same.
Lenders care about DTI because it answers one narrow question: how much of this person’s income is already spoken for before any new payment is added? A person with a low ratio has more of each month’s income free. A person with a high ratio has less room, so a new payment is harder to fit in. The ratio says nothing about how much money a person has saved, what their credit history looks like, or whether their income is stable. Those are separate questions, and lenders ask them separately.
DTI is also used outside lending. A landlord may look at the housing share when judging a rental application. A person planning their own budget may use the ratio as a single number that tracks how much of their income is committed to debt from month to month. The CFPB’s own financial empowerment toolkit suggests the ratio as a way to check the overall health of household finances, and to use it as a benchmark: as debts fall, the ratio falls with them.
What counts as debt in a DTI calculation?
What counts is every recurring monthly debt payment. That includes a mortgage payment or rent, a car loan, a student loan, minimum payments on credit cards, a personal loan, and court-ordered payments such as child support and alimony. A debt that appears on a credit report is almost always counted by a lender, and so is a court-ordered payment, even if it does not appear on a credit report.
For a mortgage, the housing payment usually means principal, interest, property taxes, homeowners insurance, and any homeowners association dues, often shortened to PITI plus HOA. In this tool, the housing field takes one figure, so add those parts together before entering it. Rent is entered in the same field. A lender calculating DTI for a mortgage application uses the proposed new housing payment, not the current one, so a person checking whether a new mortgage fits should enter the payment they would have, not the payment they have now.
Credit cards count by their minimum payment, not by the balance. A card with a balance of 5,000 and a minimum payment of 150 contributes 150 to the numerator, not 5,000. That surprises some people, but it follows the definition: the ratio measures monthly payments, not total amounts owed. The same logic applies to every other debt in the list. A car loan with 20,000 still owed contributes only its monthly payment, not the 20,000.
What does not count is just as important. Utilities, groceries, phone and internet bills, subscriptions, childcare that is not court-ordered, and insurance premiums other than homeowners insurance are living expenses, not debts, and they do not enter the ratio. That does not mean they do not matter to a budget. It means the ratio is not a budget. A person can have a low DTI and still feel squeezed, because the ratio ignores every expense that is not a debt payment. The remaining-income box on this page helps here: it shows what is left after debts, before those other expenses are paid.
Two edge cases are worth naming. A co-signed loan usually counts, because the co-signer is legally responsible for the payment if the main borrower does not pay. A student loan in deferment or forbearance may still be counted, because many lenders use an estimated payment rather than zero when no payment is currently due. If either case applies, the exact treatment depends on the lender, and the lender’s own calculation is the one that governs an application.
What is the difference between front-end and back-end DTI?
Front-end DTI, also called the housing ratio, counts only housing costs against gross monthly income. Back-end DTI, also called the total DTI, counts every monthly debt payment, housing included, against the same income. The front-end ratio is always equal to or smaller than the back-end ratio, because the back-end numerator contains the front-end numerator plus every other debt.
The two ratios exist because they answer different questions. The front-end ratio asks whether the housing cost alone fits the income. The back-end ratio asks whether all debts together fit the income. A person can pass one and fail the other. In the second verified test above, the front-end ratio is 30.00% while the back-end ratio is 32.50%. In the first test, the front-end ratio is 25.00% while the back-end ratio is 38.33%. The housing share is smaller in the first test, but the total debt is larger, because the car loan, student loan, cards, and other debts add 800 a month on top of housing.
Lenders look at both. A mortgage lender usually checks the front-end ratio first, because the mortgage is the loan being applied for, and then checks the back-end ratio to see the full picture. Some loan programs publish benchmarks for both. FHA guides, for example, often cite 31% front-end and 43% back-end as benchmarks. Other lenders may weigh the back-end ratio more heavily, because it captures the whole debt load. Either way, the two figures are read together, not in place of each other.
For a renter, the front-end ratio is the rent divided by gross monthly income. The CFPB’s toolkit suggests renters consider keeping a debt-to-income ratio of 15% to 20% or less, not counting rent, while homeowners are advised to consider keeping housing at 28% or less and all debts at 36% or less. Those are the CFPB’s suggestions for household budgeting, not lending rules, and they are quoted here as suggestions, not as limits a lender applies.
How do I calculate my DTI by hand?
The formula is one division and one multiplication: DTI = (total monthly debt payments ÷ gross monthly income) × 100. Add up every monthly debt payment first. Then divide that total by gross monthly income. Then multiply by 100 to turn the decimal into a percentage.
Take the first verified test as the hand calculation. Total monthly debt is 1,500 plus 350 plus 200 plus 150 plus 100, which is 2,300. Gross monthly income is 6,000. Divide 2,300 by 6,000 and the result is 0.383333. Multiply by 100 and the result is 38.33%. That is the back-end DTI. For the front-end DTI, use only the housing figure: 1,500 divided by 6,000 is 0.25, and multiplied by 100 it is 25.00%.
The same steps work for any figures. A household with 5,000 of gross monthly income and 1,750 of monthly debt payments has a DTI of 1,750 divided by 5,000, multiplied by 100, which is 35.00%. A household with 6,500 of income and 1,975 of debts has a DTI of 1,975 divided by 6,500, multiplied by 100, which is 30.38%. The arithmetic is the same every time, which is why the ratio is easy to check by hand and easy to verify against the tool.
One point of care: keep the time periods matched. Monthly debts must be divided by monthly income, not annual income. Dividing 2,300 of monthly debt by 72,000 of annual income gives 3.19%, which is wrong by a factor of 12. If income is known only as an annual figure, divide it by 12 first, then use it in the formula. The tool expects monthly figures in every field, and the same rule applies to a hand calculation.
To work out a share or a change as a percentage, which is the same arithmetic this ratio uses, see the percentage calculator.
What do the commonly cited DTI thresholds mean?
Three figures appear again and again in lender guides and personal-finance writing: 28%, 36%, and 43%. They are guideposts, not rules. Different loan products and lenders have different limits, as the CFPB itself states, and a ratio above a guidepost does not automatically refuse a loan, just as a ratio below one does not automatically approve it.
The 28/36 rule is the oldest of the three. It suggests keeping housing costs at or below 28% of gross monthly income and total debt payments at or below 36%. The CFPB’s toolkit echoes it for homeowners: housing at 28% or less, all debts at 36% or less. A back-end ratio of 36% or less is widely described as the range in which borrowers have enough room to meet their monthly obligations. In the second verified test, the back-end ratio of 32.50% sits below that line, and the front-end ratio of 30.00% sits above the 28% housing guidepost, which shows that the two parts of the rule can point in different directions.
The 43% figure is the one most often quoted as the upper guidepost. It comes from the CFPB’s ability-to-repay and Qualified Mortgage framework, under which lenders must consider DTI among other factors when checking that a borrower can repay a mortgage. Many lender guides still quote 43% as a reference point for the back-end ratio. In the first verified test, the back-end ratio of 38.33% sits between 36% and 43%. In the third verified test, the back-end ratio of 48.75% sits above 43%. Neither figure is a lending decision on its own. It is a position on a scale that lenders read alongside other factors.
The published limits vary by loan program, and the variation is large. Fannie Mae’s Selling Guide allows a back-end ratio of up to 45% for manually underwritten conventional loans and up to 50% through its Desktop Underwriter system where other factors are strong. FHA guides often cite 43% as the back-end benchmark, with higher ratios possible where compensating factors exist. VA loans have no formal DTI cap and rely more on residual income, which is the income left after debts and living expenses. USDA loans cap the back-end ratio at 41% in their standard guidance. The same borrower can therefore be inside one program’s limit and outside another’s, which is why a single percentage cannot settle a lending question.
The table below turns the guideposts into cash figures. It shows, for four common gross monthly incomes, the largest total monthly debt that keeps the back-end ratio at or below 36% and at or below 43%, and the largest housing payment that keeps the front-end ratio at or below 28%. Every cell is income multiplied by the guidepost: for an income of 6,000, 36% allows 2,160 of total debt, 43% allows 2,580, and 28% allows 1,680 of housing.
| Gross monthly income | Max total debt at 36% | Max total debt at 43% | Max housing at 28% |
|---|---|---|---|
| 4,000 | 1,440.00 | 1,720.00 | 1,120.00 |
| 5,000 | 1,800.00 | 2,150.00 | 1,400.00 |
| 6,000 | 2,160.00 | 2,580.00 | 1,680.00 |
| 8,000 | 2,880.00 | 3,440.00 | 2,240.00 |
Read the first verified test against this table. At an income of 6,000, total debt of 2,300 is above the 36% maximum of 2,160 and below the 43% maximum of 2,580, which matches the back-end ratio of 38.33%. Housing of 1,500 is below the 28% maximum of 1,680, which matches the front-end ratio of 25.00%.
How do lenders use DTI alongside other factors?
DTI is one factor in a lending decision, never the whole decision. Lenders also look at credit history and credit score, the size of the loan against the value of what secures it, savings and reserves, employment history and income stability, and, for some loan types, residual income after debts and living expenses. A strong credit history and large reserves can sit alongside a higher DTI. A thin credit history or unstable income can sit alongside a low DTI. The ratio is a starting point for the conversation, not the end of it.
Lenders also recalculate DTI with the loan being applied for. A mortgage application is judged on the DTI that includes the proposed new mortgage payment, not the DTI as it stands today. That is why the housing field in this tool should hold the payment that would apply after the new loan, when the question is whether a new loan fits. A current DTI of 30% can become a proposed DTI of 40% once the new payment is added, and it is the proposed figure the lender works with.
Lenders verify both numbers in the ratio. Income is checked against pay slips, tax returns, and bank statements, not taken on trust. Debts are checked against a credit report, which lists the monthly payments a lender must count, and may include debts a borrower forgot to list. Self-employed income is usually averaged over the last two years of tax returns: net profit from the two most recent years is added together and divided by 24 to give a monthly figure. Variable income, such as commission or overtime, is usually averaged over a similar period rather than taken from a single good month.
DTI also matters outside mortgages. Auto lenders, personal loan lenders, and credit card issuers use the same ratio, with limits of their own. A landlord may use the front-end ratio alone. The ratio is the same arithmetic in every case. What changes is the limit applied to it, and the other factors read alongside it.
How can DTI change?
DTI is a fraction, so it can change in two places: the numerator or the denominator. The numerator is total monthly debt payments. The denominator is gross monthly income. Anything that changes one of those two numbers changes the ratio, and nothing else does.
Lowering the numerator lowers the ratio. Paying down a balance lowers the numerator only when the monthly payment ends or falls. Paying a card balance down part-way does not change the ratio if the minimum payment stays the same, because the ratio counts payments, not balances. Paying off a small loan entirely removes its whole monthly payment from the numerator at once. In the first verified test, total debt is 2,300 on an income of 6,000, giving 38.33%. If the “other debts” payment of 100 ended, total debt would fall to 2,200, and the ratio would fall to 2,200 divided by 6,000, multiplied by 100, which is 36.67%. If the student loan payment of 200 also ended, total debt would fall to 2,000, and the ratio would fall to 2,000 divided by 6,000, multiplied by 100, which is 33.33%.
Raising the denominator lowers the ratio by the same arithmetic. If income rises and debts stay the same, the same debts are a smaller share of a larger income. In the first verified test, total debt of 2,300 on an income of 6,000 gives 38.33%. If income rose to 7,000 with debts unchanged, the ratio would be 2,300 divided by 7,000, multiplied by 100, which is 32.86%. The debts did not change. The share changed, because the denominator grew.
Adding a new monthly payment raises the numerator and raises the ratio. In the second verified test, total debt of 1,300 on an income of 4,000 gives 32.50%. Adding a car payment of 350 would raise total debt to 1,650, and the ratio would rise to 1,650 divided by 4,000, multiplied by 100, which is 41.25%. That is the arithmetic behind the common suggestion to avoid taking on new monthly payments before applying for a loan. It is arithmetic, not a recommendation about any person’s finances. This page gives general information only, and it does not give financial advice.
Refinancing changes the numerator when it changes the monthly payment. A loan refinanced to a lower monthly payment lowers total monthly debt, and the ratio falls. A loan refinanced to a higher monthly payment raises total monthly debt, and the ratio rises. The rate and the term matter only through the payment they produce. The ratio itself does not know or care why a payment changed. It only records the new payment.
What does the quick-reference table show?
The table below is computed from the same formula the tool uses, so every cell can be checked by hand: total monthly debt divided by gross monthly income, multiplied by 100. Rows are gross monthly incomes. Columns are total monthly debt payments. Read across a row to see how the ratio rises as debts grow on the same income. Read down a column to see how the ratio falls as income grows on the same debts.
| Gross monthly income | Total debt 500 | Total debt 1,000 | Total debt 1,500 | Total debt 2,000 | Total debt 2,500 | Total debt 3,000 |
|---|---|---|---|---|---|---|
| 3,000 | 16.67% | 33.33% | 50.00% | 66.67% | 83.33% | 100.00% |
| 4,000 | 12.50% | 25.00% | 37.50% | 50.00% | 62.50% | 75.00% |
| 5,000 | 10.00% | 20.00% | 30.00% | 40.00% | 50.00% | 60.00% |
| 6,000 | 8.33% | 16.67% | 25.00% | 33.33% | 41.67% | 50.00% |
| 8,000 | 6.25% | 12.50% | 18.75% | 25.00% | 31.25% | 37.50% |
| 10,000 | 5.00% | 10.00% | 15.00% | 20.00% | 25.00% | 30.00% |
Two patterns stand out. First, the same debt is a very different ratio at different incomes: 2,000 of monthly debt is 66.67% of a 3,000 income and 20.00% of a 10,000 income. Second, the guideposts cut across the table in a diagonal line. The 36% guidepost is crossed between 1,000 and 1,500 of debt on a 3,000 income, between 1,500 and 2,000 on a 4,000 income, and between 2,500 and 3,000 on an 8,000 income. A reader can find the nearest row and column to their own figures and see roughly where they stand before entering exact numbers in the tool.
Check one cell by hand. Take an income of 5,000 and total debt of 1,500. Divide 1,500 by 5,000 and the result is 0.30. Multiply by 100 and the result is 30.00%, which matches the table. Take an income of 8,000 and total debt of 2,500. Divide 2,500 by 8,000 and the result is 0.3125. Multiply by 100 and the result is 31.25%, which matches the table and also matches the front-end ratio in the third verified test, where housing of 2,500 on an income of 8,000 gives the same 31.25%.
What mistakes do people commonly make with DTI?
The first mistake is using take-home pay instead of gross income. Take-home pay is smaller than gross income, because tax and deductions have already been taken out, so the same debts divided by a smaller number give a larger ratio. In the first verified test, total debt of 2,300 divided by gross income of 6,000 gives 38.33%. If take-home pay were 4,500, the same debts would give 2,300 divided by 4,500, multiplied by 100, which is 51.11%. That second figure is not the DTI a lender calculates. Lenders use gross income, and so does this tool. If only take-home pay is known, the gross figure has to be found first, from a pay slip or an annual salary divided by 12.
The second mistake is using credit card balances instead of minimum payments. A balance is a total owed. A minimum payment is the monthly amount due. The ratio counts the monthly amount. Entering a balance of 5,000 where a minimum payment of 150 belongs would add 4,850 too much to the numerator and overstate the ratio badly. The same error in reverse is entering 0 for a card that has a balance and a minimum payment, which understates the ratio.
The third mistake is forgetting a debt. Student loans, co-signed loans, child support, and alimony are the ones most often left out, because they do not always appear on the same statement as the mortgage or the car loan. A forgotten payment of 200 a month on an income of 6,000 understates the ratio by 3.33 percentage points, because 200 divided by 6,000, multiplied by 100, is 3.33%. The separate fields in this tool exist so each debt type is entered on its own and none is skipped by accident.
The fourth mistake is leaving out the proposed new payment. A DTI calculated on current debts only answers whether current debts fit current income. A lender judging a new loan calculates DTI with the new payment included. The gap between the two can be large: in the second verified test, current total debt of 1,300 on 4,000 gives 32.50%, but adding a proposed housing payment increase of 400 would give 1,700 on 4,000, which is 42.50%. Enter the payment that would apply, not only the payment that applies today, when the question is about a new loan.
The fifth mistake is mixing time periods. Monthly debts must be divided by monthly income. Annual income must be divided by 12 before it is used. A weekly payment must be multiplied by 52 and divided by 12 before it is used. Any figure in the wrong period makes the ratio wrong by the same factor, and the error is easy to miss because the result still looks like a percentage.
The sixth mistake is treating the ratio as a lending decision. DTI is one factor among several, and it does not approve or refuse a loan. A ratio under 36% does not guarantee approval, and a ratio over 43% does not guarantee refusal. Credit history, reserves, the loan-to-value ratio, employment history, and the rules of the specific loan program all sit alongside it. The reading box on this page describes where a ratio sits against commonly cited guideposts. It is not a lending decision, and it is not financial advice.
What are the limits of this calculator?
This calculator gives an informational estimate from the numbers entered. It does not pull a credit report, verify income with an employer or a tax return, or check a lender’s own rules. A lender’s calculation can differ, because lenders may count a debt differently, use an estimated payment for a deferred student loan, include a co-signed loan, or apply their program’s own rules for variable income. The figure here is a starting point for understanding the ratio, not a substitute for a lender’s formal calculation.
The housing field takes a single monthly figure. It does not split a mortgage into principal, interest, taxes, insurance, and association dues, and it does not estimate any of those parts. A reader who knows only the principal and interest part of a mortgage should add taxes, insurance, and dues before entering the figure, because a lender counts the whole housing payment. The tool also does not add a proposed new loan payment by itself. That payment has to be entered in the housing field or in “Other monthly debts” for the result to reflect it.
The tool carries no currency symbol, so the same figures work in any currency as long as income and debts are entered in the same one. Mixing currencies would make the ratio meaningless, because the numerator and the denominator would be measured in different units. The figures are also rounded to two decimal places for display, while the calculation keeps full precision inside. Multiplying a rounded percentage back out can differ by a few cents from the tool’s own figures, which is normal rounding, not an error.
Finally, the guideposts in the reading box are general figures cited across lender guides and the CFPB’s materials. They vary by lender and loan type, and they change over time as lending rules change. A ratio that sits above a guidepost today may sit inside a different program’s limit, and a ratio that sits below a guidepost may still be judged alongside other factors. This page gives general information only. It does not give financial advice, approve a loan, check credit, or replace a lender’s formal offer.
What information does this tool store?
This tool works from the numbers typed into it on the page. It does not ask for a name, an email address, or any account detail, and it does not send the figures anywhere. Income and debt figures stay in the browser and are never stored or shared. A reader who wants to keep a result can note it down separately. The results are shown on the page in the labelled boxes above, and the worked examples in this article use only the verified test figures listed at the end, so a reader can check the tool against a known answer before trusting it with real figures.
For more tools in the same collection, browse the calculators category.
Frequently asked questions
FAQ 1 — How do I calculate my debt to income ratio?
Add up all your monthly debt payments, divide the total by your gross monthly income, and multiply by 100. For example, 2,300 of monthly debt divided by 6,000 of gross monthly income, multiplied by 100, is 38.33%. Use gross income before tax, not take-home pay, and use minimum payments for credit cards, not balances.
FAQ 2 — What is a good debt to income ratio?
A back-end ratio of 36% or less is widely cited as a general guidepost, and a front-end housing ratio of 28% or less is the matching housing guidepost. A ratio between 36% and 43% sits between two commonly cited guideposts, and a ratio over 43% sits above the figure most often quoted as the upper guidepost. Limits vary by lender and loan type, and some loan programs allow higher ratios where other factors are strong.
FAQ 3 — What is the difference between front-end and back-end DTI?
Front-end DTI counts only housing costs against gross monthly income. Back-end DTI counts every monthly debt payment, housing included, against the same income. In the first verified test, the front-end ratio is 25.00% and the back-end ratio is 38.33% on the same income of 6,000, because the car loan, student loan, cards, and other debts add 800 a month on top of housing.
FAQ 4 — Does rent count in a debt to income ratio?
Yes, for the front-end ratio. Rent is entered in the housing field of this tool, in the same place as a mortgage payment. For a mortgage application, lenders use the proposed new housing payment, including principal, interest, taxes, insurance, and association dues, rather than the current rent or mortgage payment.
FAQ 5 — Do credit card balances count, or only minimum payments?
Only the minimum payments count. DTI measures monthly payments, not total amounts owed. A card with a balance of 5,000 and a minimum payment of 150 contributes 150 to the total monthly debt, not 5,000. Entering the balance instead of the minimum payment would overstate the ratio.
FAQ 6 — Is my income and debt information uploaded or stored?
No. The calculation runs entirely in your browser. Your figures are never sent to a server, stored, or shared. The tool asks for no name, email address, or account detail.
How do I calculate my debt to income ratio?
Add up all your monthly debt payments, divide the total by your gross monthly income, and multiply by 100. For example, 2,300 of monthly debt divided by 6,000 of gross monthly income, multiplied by 100, is 38.33%. Use gross income before tax, not take-home pay, and use minimum payments for credit cards, not balances.
What is a good debt to income ratio?
A back-end ratio of 36% or less is widely cited as a general guidepost, and a front-end housing ratio of 28% or less is the matching housing guidepost. A ratio between 36% and 43% sits between two commonly cited guideposts, and a ratio over 43% sits above the figure most often quoted as the upper guidepost. Limits vary by lender and loan type, and some loan programs allow higher ratios where other factors are strong.
What is the difference between front-end and back-end DTI?
Front-end DTI counts only housing costs against gross monthly income. Back-end DTI counts every monthly debt payment, housing included, against the same income. In the first verified test, the front-end ratio is 25.00% and the back-end ratio is 38.33% on the same income of 6,000, because the car loan, student loan, cards, and other debts add 800 a month on top of housing.
Does rent count in a debt to income ratio?
Yes, for the front-end ratio. Rent is entered in the housing field of this tool, in the same place as a mortgage payment. For a mortgage application, lenders use the proposed new housing payment, including principal, interest, taxes, insurance, and association dues, rather than the current rent or mortgage payment.
Do credit card balances count, or only minimum payments?
Only the minimum payments count. DTI measures monthly payments, not total amounts owed. A card with a balance of 5,000 and a minimum payment of 150 contributes 150 to the total monthly debt, not 5,000. Entering the balance instead of the minimum payment would overstate the ratio.
Is my income and debt information uploaded or stored?
No. The calculation runs entirely in your browser. Your figures are never sent to a server, stored, or shared. The tool asks for no name, email address, or account detail.