Adult Height Predictor
Enter the heights of the child’s two biological parents and the child’s sex. The tool uses the mid-parental height method: it averages the parents’ heights and adjusts the result by 13 cm for the child’s sex. The optional current height and age do not change the prediction, because this method uses only the parents’ heights.
The prediction is an estimate based only on the parents’ heights. It is not a medical prediction, and it cannot tell you when a child will reach their adult height. For a real growth assessment, a doctor plots a child on a growth chart over time.
An adult height predictor estimates how tall a child will be when fully grown. This one uses the mid-parental height method: it averages the heights of the child’s two biological parents and adjusts the result by 13 cm for the child’s sex, then gives the expected range around that figure.
How do I use the Adult Height Predictor?
Choose the child’s sex first, then choose the height units: centimetres, or feet and inches. Enter the father’s height and the mother’s height. Both are required, because the method averages the two of them. Use measured heights where you can. People tend to overstate their own height by a centimetre or two, and any error in a parent’s height carries straight through into the prediction, since the formula averages the two numbers as given.
The child’s current height and age are optional, and they do not change the result. They are there so a parent can record them alongside the prediction, and the tool says so in a note under the results when they are entered. If you enter a current height without an age, or an age without a current height, the note says which figure was entered and that it did not change the prediction.
Press the predict button and three labelled boxes appear. The first box is the predicted adult height, in centimetres and in feet and inches. The second box is the expected range, which is the prediction plus or minus 8.5 cm, also in both units. The third box is the mid-parental height itself — the plain average of the two parents’ heights, before the 13 cm sex adjustment — so you can see what the formula started from.
If an input is wrong, the tool shows a plain-language error and no results. A missing parent’s height is rejected, because the average cannot be worked out from one parent alone. A parent’s height below 120 cm or above 220 cm is rejected, because it falls outside the range the tool accepts for an adult parent — it is almost always a typing error, such as entering a height in inches where centimetres were expected. A child’s current height below 40 cm or above 220 cm is rejected for the same reason. An age above 18 is rejected with a message that growth is usually complete by then, so the current height is the best guide and a predictor adds nothing.
What does a worked example from the live tool look like?
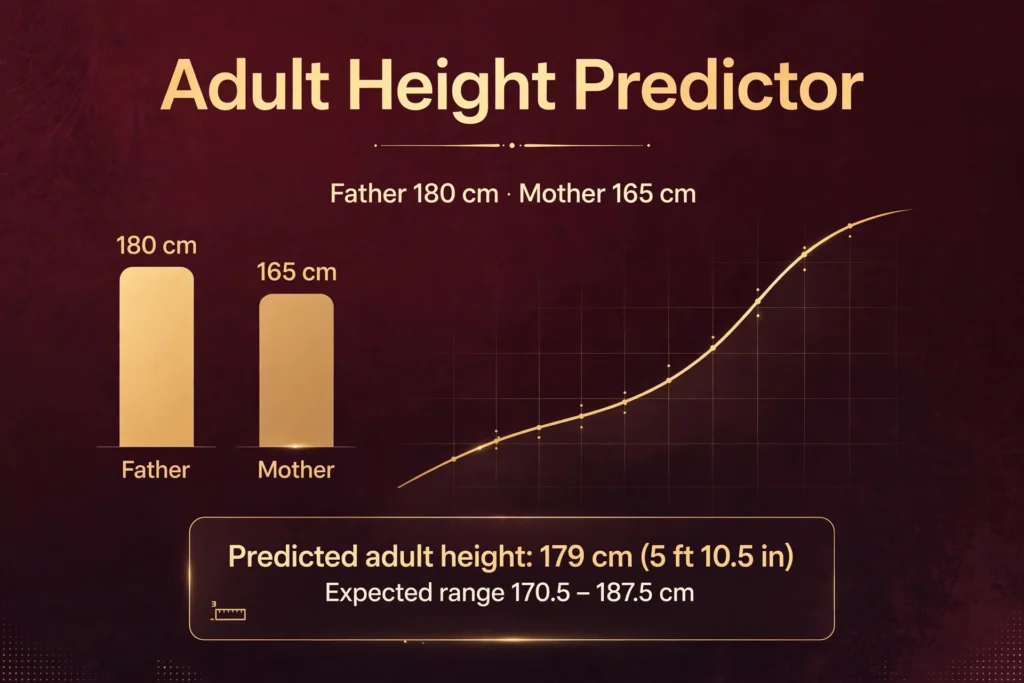
Start with the first verified test. Enter a father of 180 cm and a mother of 165 cm, and choose boy. Add the two heights: 180 + 165 = 345. Add 13 cm for a boy: 345 + 13 = 358. Divide by 2: 358 / 2 = 179. The predicted adult height is 179 cm, which is 5 ft 10.5 in. The expected range is 179 cm plus or minus 8.5 cm, which is 170.5 cm to 187.5 cm, or 5 ft 7.1 in to 6 ft 1.8 in. The mid-parental height — the plain average of the two parents — is 172.5 cm. This is the example most reference pages use, and the tool agrees with it exactly.
A second test changes the sex and the parents. Enter a father of 175 cm and a mother of 160 cm, and choose girl. Add the two heights: 175 + 160 = 335. Subtract 13 cm for a girl: 335 − 13 = 322. Divide by 2: 322 / 2 = 161. The predicted adult height is 161 cm, which is 5 ft 3.4 in. The expected range is 152.5 cm to 169.5 cm, or 5 ft 0 in to 5 ft 6.7 in. The mid-parental height is 167.5 cm. The girl’s prediction is 13 cm below the boy’s prediction for the same parents, because the 13 cm adjustment is split between the two sexes: a boy gets half of it added and a girl gets half of it subtracted, which is 6.5 cm each way from the parents’ average.
A third test uses feet and inches. Enter a father of 5 ft 11 in and a mother of 5 ft 5 in, and choose boy. The tool converts first: 5 ft 11 in is 71 inches, and 71 × 2.54 = 180.3 cm; 5 ft 5 in is 65 inches, and 65 × 2.54 = 165.1 cm. Add them: 180.3 + 165.1 = 345.4. Add 13 cm: 345.4 + 13 = 358.4. Divide by 2: 358.4 / 2 = 179.2. The predicted adult height is 179.2 cm, which is 5 ft 10.6 in, with an expected range of 170.7 cm to 187.7 cm. The small difference from the first test — 179.2 cm instead of 179 cm — comes from the conversion itself: 5 ft 11 in is 180.3 cm, not exactly 180 cm, and 5 ft 5 in is 165.1 cm, not exactly 165 cm. That is why the tool converts and then calculates, rather than rounding the parents’ heights first.
What is the mid-parental height method?
The mid-parental height method is a formula for a child’s genetic height target. It takes the measured adult heights of the child’s two biological parents, averages them, and adjusts the average for the child’s sex. The adjustment exists because adult men are, on average, taller than adult women. In the data the paediatrician James Tanner used when he formalised the method in 1970, that average gap was 13 cm, which is about 5.1 inches. The formula is:
- For a boy: (father’s height + mother’s height + 13 cm) ÷ 2
- For a girl: (father’s height + mother’s height − 13 cm) ÷ 2
There is an equivalent way to read the same formula. Average the two parents’ heights, then add 6.5 cm for a boy or subtract 6.5 cm for a girl. Both give the same answer, because 13 cm divided by 2 is 6.5 cm. The American Academy of Pediatrics states the same method in inches on its HealthyChildren.org page: for a boy, add the mother’s height plus 5 inches to the father’s height and divide by 2; for a girl, add the father’s height minus 5 inches to the mother’s height and divide by 2. The 5 inches there is the rounded equivalent of 13 cm — 5 inches is 12.7 cm, not 13 cm — so the inch version and the centimetre version can differ by a fraction of a centimetre. This tool calculates in centimetres and converts the result, so its figures follow the 13 cm version exactly.
The method is used in paediatric clinics as a first pass, not as a final answer. A doctor plots a child’s measured height on a growth chart over time and compares the child’s path with the mid-parental target. If the child’s growth follows a steady line near the target, that is reassuring. If the child’s growth drifts well away from the target, or crosses percentile lines downward, that is a reason to look further. The formula on its own cannot do that comparison, because it knows nothing about the child — only about the parents.
The method works at any age, including before a child is born, because it needs no measurement of the child at all. That is also its main weakness: it cannot see whether a particular child inherited the tall side or the short side of the family, whether the child is an early or late developer, or whether anything in the child’s health or nutrition is pulling growth off its genetic path. All of that uncertainty is carried in the expected range, which is the subject of the next section.
What does the expected range of ±8.5 cm mean?
The expected range is the prediction plus or minus 8.5 cm. For the first worked example it runs from 170.5 cm to 187.5 cm. That band is not a guess: it is the interval Tanner gave for the method, and it is meant to run from roughly the 3rd percentile to the 97th percentile of outcomes for children with those parents. Most children with those parents land inside it, and most land nearer the middle than the edges.
The band exists because a child’s adult height is not fixed by the parents’ heights alone. Each child draws a different mix of the genes the two parents carry, and nutrition, health and timing all move the result within the band. Two children of the same parents can end up at different points inside the same range, and a child at the bottom of the range is not doing anything wrong. The band is wide because the method knows so little about the child.
Read the range as a band of plausible outcomes, not as a promise. A prediction of 179 cm with a range of 170.5 cm to 187.5 cm means the child is most likely to land near 179 cm, and very likely to land somewhere between 170.5 cm and 187.5 cm. It does not mean the child will be 179 cm, and it does not mean the child cannot land outside the band — a small number of children do, because the band covers roughly the 3rd to the 97th percentile, not every child.
The range is the same width for every prediction: always plus or minus 8.5 cm, whatever the parents’ heights. The Khamis-Roche method, described in the next section, gives a narrower range of about 5.3 cm for boys and 4.3 cm for girls, because it uses the child’s own measurements as well. That is the trade-off between the two methods: the mid-parental method needs only the parents’ heights and gives a wide range; the Khamis-Roche method needs much more information and gives a narrower one.
What other ways are there to predict adult height?
The mid-parental method is the simplest, but it is not the only one. Three other approaches are used in practice, and they differ in what they need and how accurate they are. The table at the end of this section is not a table — the comparison is given in words, because the methods differ in too many ways for a single row of numbers to capture.
The Khamis-Roche method is the most accurate published method that does not need an X-ray. It was developed by Harry Khamis and Alex Roche from the Fels Longitudinal Study and published in Pediatrics in 1994. It takes the child’s age, sex, current height and weight, plus the average of the two parents’ heights, and it applies age-specific coefficients. It covers ages 4 to 17.5, and in the original validation 90 percent of boys ended up within about 5.3 cm of the prediction and 90 percent of girls within about 4.3 cm. That is a narrower band than the mid-parental method’s 8.5 cm, because the child’s own measurements carry real information about where that child is heading.
This tool does not include the Khamis-Roche method, and the reason is a matter of record, not of preference. The method needs a table of coefficients for each age and sex, and the only published source for that table is the 1994 Pediatrics paper and a 1995 erratum. The erratum corrected the weight coefficient column, and copies of the table available online disagree on that column — some carry the original, uncorrected figures and some carry the corrected ones, and there is no citable source that settles which is which. A tool that used the wrong column would give wrong predictions without any way for a reader to spot the error. So this tool uses the mid-parental method only, and says so plainly, rather than including a method it cannot verify.
Bone-age methods are the clinical standard for a child whose growth is a concern. A doctor takes an X-ray of the child’s left hand and wrist, reads the maturity of the bones against an atlas, and feeds the bone age into a formula with the child’s height. The Bayley-Pinneau method, published in 1952, is the best known, and the Tanner-Whitehouse method, published in 1975 and revised in 2001, is the most detailed. Both are more accurate than the mid-parental method, and both need a clinician and an X-ray, which is why they are not in this tool.
Growth-chart percentile tracking is the method a doctor uses at every check-up, and it needs no formula at all. The doctor plots the child’s measured height on a chart of children the same age and sex, and watches whether the child stays on the same percentile line. A child who stays near the 75th percentile from age two to age ten is likely to end up near the 75th percentile as an adult. A child whose line drifts downward is a reason to look further, even if the mid-parental prediction looks fine. The chart needs repeated measurements over years to work, which is why a single prediction from the parents’ heights cannot replace it.
The doubling method is the one to ignore. It says a child’s adult height is twice the height at age two, or twice the height at 18 months for a girl. There is no published study behind it, and it fails whenever a child is an early or late developer. A child who is tall at two because of an early growth spurt will be overestimated, and a child who is short at two because of a late spurt will be underestimated. It survives because it is easy to remember, not because it works.
What factors affect how tall a child grows?
Genetics sets the range, and everything else moves a child within it. A child inherits half of their height genes from each parent, and the mix is different for every child, which is why two siblings can end up several centimetres apart. Twin studies put the heritability of adult height at roughly 80 percent, which means most of the difference between adults comes from genes, not from anything a parent did or did not do. The mid-parental method works because it captures that genetic signal in two numbers: the parents’ heights.
Nutrition matters most in the early years, when growth is fastest. A child who is undernourished in the first few years of life grows more slowly, and the lost growth is not always caught up later. The nutrients that matter most are protein, calcium, vitamin D and zinc, and a balanced diet that includes them is enough — no supplement has been shown to make a well-fed child taller. Severe malnutrition in childhood is the main cause of short stature worldwide, and it is also the main reason the average height of a population rises as a country grows richer.
Health matters too. A chronic illness in childhood, such as coeliac disease or an underactive thyroid, can slow growth, and the growth usually catches up once the illness is treated. Medicines can have the same effect: some asthma inhalers and some medicines for attention-deficit hyperactivity disorder slow growth by a small amount while they are taken, and the growth usually catches up when the dose is lowered or the medicine is stopped. A child whose growth slows for no clear reason is a reason to talk to a doctor, not a reason to wait and see.
Sleep and puberty set the timing. Growth hormone is released mainly during deep sleep, and a child who regularly sleeps far less than their age needs grows more slowly, though the effect is small. Puberty is when most of the remaining growth happens: a boy gains roughly 25 cm during puberty and a girl roughly 20 cm, and the timing varies widely. An early developer reaches their adult height sooner and stops growing sooner; a late developer starts later and keeps growing later. That is why the mid-parental method, which ignores timing entirely, gives a wide range rather than a precise figure.
None of these factors can push a child far outside the range the tool gives, unless something is seriously wrong. A healthy, well-fed child with no chronic illness will land inside the expected range, most likely near the middle. A child who lands far outside it — well above or well below — is a reason to talk to a doctor, because the gap is more likely to be a health matter than a genetic surprise.
How accurate is an adult height prediction?
Accuracy is measured in centimetres of error, not in percentages. For the mid-parental method this tool uses, the expected range is the prediction plus or minus 8.5 cm, which Tanner set to run from roughly the 3rd to the 97th percentile of outcomes. Most children with those parents land inside the range, most likely near the middle. The Khamis-Roche method tightens that to about 5.3 cm for boys and 4.3 cm for girls, 90 percent of the time, and bone-age methods land in a similar band of roughly 4 to 6 cm.
The accuracy of any prediction depends on the accuracy of the inputs. A parent’s height that is overstated by 2 cm moves the prediction by 1 cm, because the formula averages the two parents and halves the error. A parent’s height that is understated by 2 cm moves the prediction by 1 cm the other way. Measured heights are better than remembered heights for this reason, and a height measured in shoes is not a height at all. The tool does not check whether the heights entered are measured or remembered — it takes them as given.
Accuracy also depends on the child. The mid-parental method is most accurate for a child who follows the usual pattern of growth: a steady percentile line, a puberty at the usual age, and no chronic illness. It is least accurate for a child who is an early or late developer, because the method has no way of knowing when that child’s growth spurt will come. A prediction made for a young child should be revisited as the child grows, using measured heights plotted over time, because the child’s own growth pattern carries more information than the parents’ heights alone.
What mistakes do people commonly make when predicting height?
The first mistake is entering a parent’s height in the wrong units. A father who is 5 ft 11 in is 180 cm, not 5.11 cm, and a mother who is 5 ft 5 in is 165 cm, not 5.5 cm. The tool has a units selector for this reason: choose centimetres and enter 180, or choose feet and inches and enter 5 ft 11 in. Entering 5.11 as a centimetre figure gives a father of 5.11 cm, which the tool rejects as too low, but entering 71 as a centimetre figure gives a father of 71 cm, which is also rejected. The error message says which figure is wrong, so check the units before you check the number.
The second mistake is using a remembered height instead of a measured one. People overstate their own height by a centimetre or two on average, and a parent who says 182 cm when they are 180 cm moves the prediction by 1 cm. That is a small error, but it is avoidable: measure both parents barefoot against a wall, or use the height from a recent medical record. A height in shoes is not a height, and a height from ten years ago is not a height now — adults lose a little height with age, and the loss accelerates after 50.
The third mistake is using a step-parent’s height, or a grandparent’s height, in place of a biological parent’s. The method needs the two biological parents, because the child inherits half of their height genes from each of them. A step-parent’s height tells you nothing about the child’s genes, and a grandparent’s height is one generation too far back. If one biological parent’s height is unknown, there is no valid mid-parental prediction, and the tool refuses to calculate with one parent alone rather than guessing.
The fourth mistake is treating the prediction as a promise. A prediction of 179 cm with a range of 170.5 cm to 187.5 cm does not mean the child will be 179 cm, and it does not mean the child will be inside the range. It means the child is most likely to land near 179 cm, and very likely to land somewhere inside the range. A child who lands outside it is not doing anything wrong, and a child who lands at the bottom of it is not doing anything wrong either. The range is a band of plausible outcomes, and the prediction is the middle of that band.
The fifth mistake is confusing height with weight. A tall child is not necessarily a healthy child, and a short child is not necessarily an unhealthy one. Height and weight are different measurements, and they need different tools: the ideal weight calculator gives a healthy weight range for a height, and the BMI calculator gives a body mass index from a height and a weight. This tool predicts height only, and it says nothing about weight.
The sixth mistake is using the child’s current height as if it were a prediction. A child’s current height on its own does not give a reliable adult prediction, because children grow at different rates and reach their growth spurt at different ages. Current height only helps when it is combined with age, weight and the parents’ heights, as the Khamis-Roche method does, or when it is tracked as a percentile over time on a growth chart. The age calculator is the tool for working out a child’s exact age from a date of birth, which is the first step in any method that uses age.
When should I talk to a doctor about my child’s height?
Talk to a doctor if your child’s growth slows for no clear reason. A child whose height percentile drops by two or more lines on a growth chart, or whose growth rate falls well below the expected rate for their age, is a reason to look further, even if the mid-parental prediction looks fine. The cause is often simple — an underactive thyroid, coeliac disease, or a medicine that slows growth — and the growth usually catches up once the cause is treated.
Talk to a doctor if your child is much shorter or much taller than the prediction. A child who lands well outside the expected range — more than 8.5 cm from the prediction in either direction — is a reason to check, because the gap is more likely to be a health matter than a genetic surprise. The same applies to a child who is much shorter than both parents, or much taller than both parents, even if the prediction looks ordinary.
Talk to a doctor if puberty comes very early or very late. A girl who starts puberty before age 8, or a boy who starts before age 9, is early, and a girl who has not started by 13, or a boy who has not started by 14, is late. Early puberty can cut growth short, because the growth plates close sooner, and late puberty can delay growth, because the growth spurt comes later. Both are usually normal variation, and both are worth a check, because a doctor can tell the difference between normal variation and a problem that needs treatment.
Talk to a doctor if you are worried, even if none of the above applies. A parent’s worry is itself a reason to check, because a doctor can measure the child, plot the growth, compare it with the mid-parental target, and say whether the pattern is reassuring or needs a closer look. The prediction this tool gives is an estimate, not a diagnosis, and it cannot replace a growth assessment by a clinician who can see the child.
How can I check the tool against a known example?
The simplest check is the first verified test: enter a father of 180 cm and a mother of 165 cm, and choose boy. The tool gives a predicted adult height of 179 cm (5 ft 10.5 in), an expected range of 170.5 cm to 187.5 cm (5 ft 7.1 in to 6 ft 1.8 in), and a mid-parental height of 172.5 cm. Work it out by hand and compare: (180 + 165 + 13) / 2 = 179, and the range is 179 cm plus or minus 8.5 cm, which is 170.5 cm to 187.5 cm. If any of the three boxes disagrees with the hand calculation, something is wrong with the inputs — the most likely cause is a height entered in the wrong units.
A second check uses feet and inches. Enter a father of 5 ft 11 in and a mother of 5 ft 5 in, and choose boy. The tool converts first — 5 ft 11 in is 71 inches, and 71 × 2.54 = 180.3 cm; 5 ft 5 in is 65 inches, and 65 × 2.54 = 165.1 cm — and then calculates: (180.3 + 165.1 + 13) / 2 = 179.2. The predicted adult height is 179.2 cm (5 ft 10.6 in), with an expected range of 170.7 cm to 187.7 cm. The small difference from the first test — 179.2 cm instead of 179 cm — comes from the conversion itself, because 5 ft 11 in is 180.3 cm and not exactly 180 cm.
A third check is the quick-reference table in the next section. Take the row for a father of 175 cm and a mother of 160 cm: the boy’s prediction is 174 cm, and the girl’s prediction is 161 cm. Enter those parents’ heights into the tool and choose boy, then choose girl, and confirm that the tool gives 174.0 cm and 161.0 cm. The percentage calculator is the tool for working out a percentage of a number, and the calculators category lists every calculator on this site. The error messages are the last check: leave the mother’s height blank and the tool says Please enter the mother’s height; enter a father of 100 cm and the tool says The father’s height looks too low; enter a child’s current height of 30 cm and the tool says The child’s current height looks too low; enter an age of 20 and the tool says The child is over 18.
The sources for this method are the paediatric literature and the public reference pages that describe it. Tanner formalised the mid-parental height method in 1970, and the American Academy of Pediatrics states the same method in inches on its HealthyChildren.org page. The Khamis-Roche method was published by Harry Khamis and Alex Roche in Pediatrics in 1994, with a 1995 erratum that corrected the weight coefficient column. The bone-age methods are Bayley-Pinneau (1952) and Tanner-Whitehouse (1975, revised 2001). The expected range of plus or minus 8.5 cm is Tanner’s interval for the method, running from roughly the 3rd to the 97th percentile of outcomes.
Quick-reference table: predicted adult height by parents’ heights
Every row in this table was computed from the same formula the tool uses: for a boy, (father + mother + 13 cm) ÷ 2, and for a girl, (father + mother − 13 cm) ÷ 2, with the expected range always the prediction plus or minus 8.5 cm. The heights are given to one decimal place, as the tool gives them, so 179.0 cm is the same as 179 cm. The first four rows raise both parents by 5 cm at a time; the last two rows show what happens when only one parent is taller.
| Father | Mother | Boy — predicted | Boy — range | Girl — predicted | Girl — range |
|---|---|---|---|---|---|
| 170 cm | 155 cm | 169.0 cm | 160.5–177.5 cm | 156.0 cm | 147.5–164.5 cm |
| 175 cm | 160 cm | 174.0 cm | 165.5–182.5 cm | 161.0 cm | 152.5–169.5 cm |
| 180 cm | 165 cm | 179.0 cm | 170.5–187.5 cm | 166.0 cm | 157.5–174.5 cm |
| 185 cm | 170 cm | 184.0 cm | 175.5–192.5 cm | 171.0 cm | 162.5–179.5 cm |
| 175 cm | 165 cm | 176.5 cm | 168.0–185.0 cm | 163.5 cm | 155.0–172.0 cm |
| 180 cm | 160 cm | 176.5 cm | 168.0–185.0 cm | 163.5 cm | 155.0–172.0 cm |
The last two rows are the ones worth reading closely. A father of 175 cm with a mother of 165 cm, and a father of 180 cm with a mother of 160 cm, give the same prediction: 176.5 cm for a boy and 163.5 cm for a girl. That is because the formula averages the two parents, so only their total matters: 175 + 165 = 340 and 180 + 160 = 340. A parent who is 5 cm taller and a parent who is 5 cm shorter cancel out exactly, and the prediction does not move. The prediction moves only when the parents’ total moves.
Frequently asked questions
How accurate is an adult height predictor?
Accuracy is measured in centimetres of error, not in percentages. For the mid-parental method this tool uses, the expected range is the prediction plus or minus 8.5 cm, which Tanner set to run from roughly the 3rd to the 97th percentile of outcomes. Most children with those parents land inside the range, most likely near the middle. The Khamis-Roche method tightens that to about ±5.3 cm for boys and ±4.3 cm for girls, 90 percent of the time, and bone-age methods land in a similar band of roughly 4 to 6 cm.
How do I predict my child’s adult height from the parents’ heights?
Use the mid-parental height method. For a boy: add the father’s height and the mother’s height, add 13 cm, and divide by 2. For a girl: add the two heights, subtract 13 cm, and divide by 2. For example, a father of 180 cm and a mother of 165 cm give a boy (180 + 165 + 13) / 2 = 179 cm and a girl (180 + 165 − 13) / 2 = 166 cm. The expected range is the prediction plus or minus 8.5 cm.
Can I predict adult height from a child’s current height alone?
No. A child’s current height on its own does not give a reliable adult prediction, because children grow at different rates and reach their growth spurt at different ages. Current height only helps when it is combined with age, weight and the parents’ heights, as the Khamis-Roche method does, or when it is tracked as a percentile over time on a growth chart. Doubling a two-year-old’s height is a rule of thumb with no research behind it.
What is the Khamis-Roche method?
It is the most accurate published method for predicting adult height without an X-ray, developed by Harry Khamis and Alex Roche from the Fels Longitudinal Study and published in Pediatrics in 1994. It takes the child’s age, sex, current height and weight, plus the average of the two parents’ heights, and applies age-specific coefficients. It covers ages 4 to 17.5, and in the original validation 90 percent of boys ended up within about 5.3 cm of the prediction and 90 percent of girls within about 4.3 cm. This tool does not include it, because its full coefficient table could not be verified from a citable source — the 1995 erratum corrected the weight coefficient column, and copies of the table available online disagree on that column.
Does the predictor work when one parent’s height is unknown?
No. The mid-parental method needs the measured adult heights of both biological parents, because it averages the two of them. For an adopted child, or when one parent’s height is unknown, there is no valid mid-parental prediction, and substituting another relative’s height does not fix it. This tool requires both parents’ heights and refuses to calculate with only one, rather than guessing at the missing figure.
At what age is a height prediction most reliable?
The mid-parental prediction does not get more accurate as the child grows, because it uses only the parents’ heights — the same two numbers give the same answer at age two and at age twelve. What improves with age is a prediction based on the child’s own measurements: the Khamis-Roche method and growth-chart tracking both tighten as the child gets older and more is known about their growth pattern. A prediction made when a child is young should be revisited as the child grows, using measured heights plotted over time.