Heart Rate Range For Fat Burning
Enter your age, choose how to estimate your maximum heart rate, and add your resting heart rate if you know it. The tool works out your maximum heart rate, your fat-burning zone, and all five training zones in beats per minute.
Maximum heart rate is an estimate from your age, not a measured value. The 220-minus-age formula and the Tanaka formula are population averages, and published checks put their error at roughly 7 to 11 beats per minute. The fat-burning zone is the range where the highest share of the calories burned during exercise comes from fat. Your entries stay in your browser.
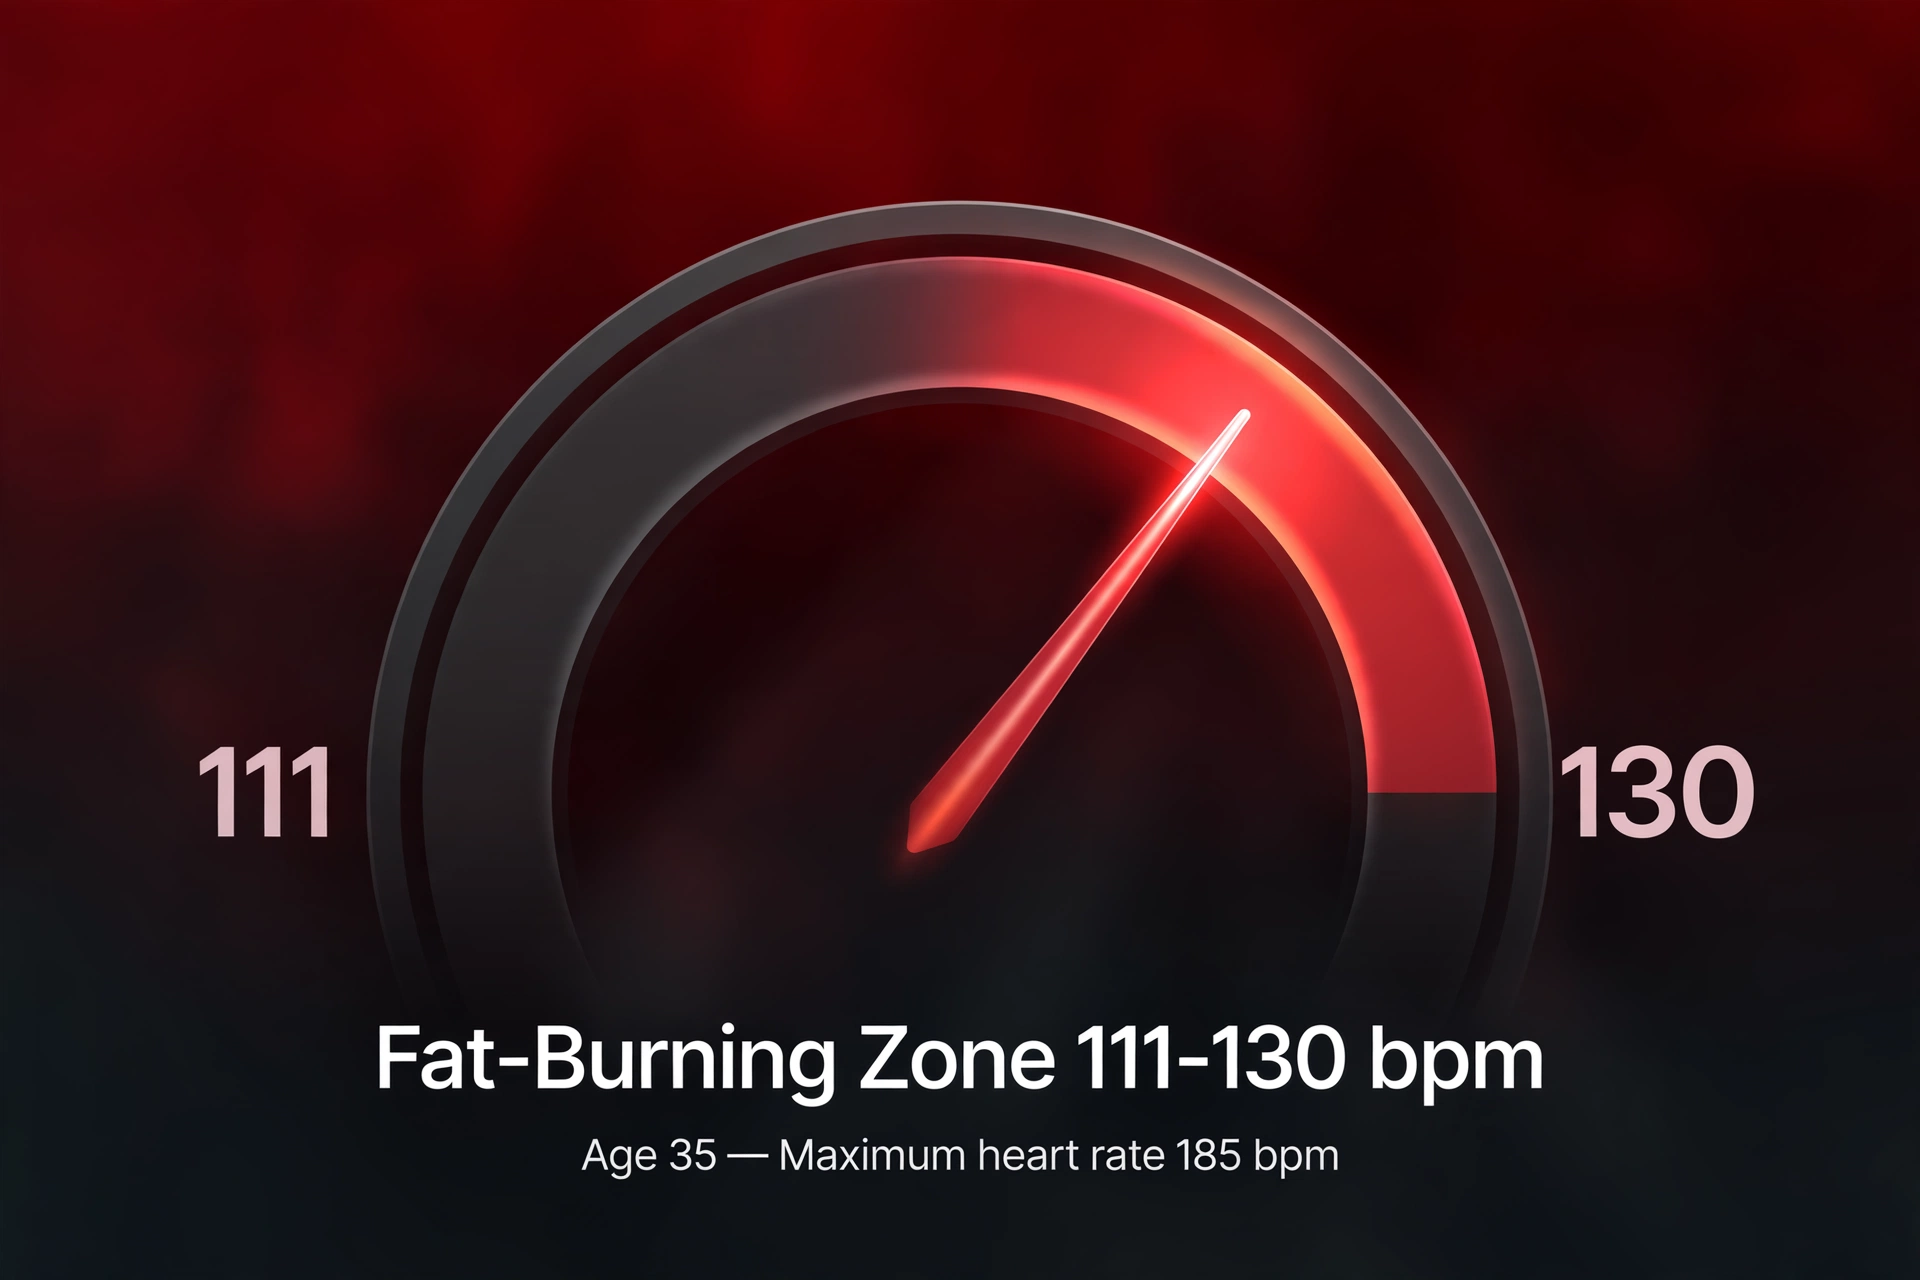
Your fat-burning heart rate zone is 60% to 70% of your estimated maximum heart rate. For a 35-year-old, that works out to 111 to 130 beats per minute.
How do I use the Heart Rate Range For Fat Burning tool?
Enter your age in years first. The tool accepts ages from 1 to 100. If you know your age in years but want it exact from a date of birth, the age calculator works it out in years, months and days.
Next, choose how to estimate your maximum heart rate. The standard choice is 220 minus age, which is the formula the American Heart Association chart uses. The other choice is the Tanaka formula, 208 minus 0.7 times age, which was built from a large set of published studies and tends to give a slightly higher maximum for older adults. The tool defaults to 220 minus age. You can run it once with each method and compare the two answers: for a 35-year-old they differ by only 1 beat per minute, but the gap grows with age, and the worked examples below show both.
The resting heart rate box is optional. Leave it blank and the tool gives you the fat-burning zone as a straight percentage of your maximum heart rate, plus all five training zones. Enter your resting heart rate and the tool adds two more boxes: your heart rate reserve, which is your maximum minus your resting rate, and the Karvonen version of the fat-burning zone, which is worked out from that reserve instead of from the maximum alone. The Karvonen version is the more personal figure, because it takes account of how low your heart rate sits at rest.
Press the calculate button and the result boxes appear. The first box shows your estimated maximum heart rate in beats per minute. The second shows your fat-burning zone, the range from 60% to 70% of that maximum. If you entered a resting heart rate, two more boxes appear with your heart rate reserve and your Karvonen fat-burning zone. Under the boxes, a table lists all five training zones for your age, each with its percentage band and its heart rate range in beats per minute. A note under the table repeats the arithmetic, so you can check every figure by hand.
If an input is wrong, the tool shows a plain-language error and no results. A blank age is rejected, an age of 0 or below is rejected, and an age above 100 is rejected. A resting heart rate below 20 or above 200 beats per minute is rejected. A resting heart rate equal to or above your estimated maximum is also rejected, because heart rate reserve would then be zero or negative, and the Karvonen method would have nothing to work from. A blank resting heart rate box is not an error: it simply means the Karvonen boxes stay hidden.
What does a worked example look like?
Start with the simplest case, the first test: a 35-year-old, using 220 minus age, with no resting heart rate entered. The maximum heart rate is 220 minus 35, which is 185 beats per minute. The fat-burning zone is 60% to 70% of 185: 60% of 185 is 111, and 70% of 185 is 129.5, which rounds to 130. So the zone is 111 to 130 beats per minute. The five training zones for the same person are Zone 1, 93 to 111; Zone 2, 111 to 130; Zone 3, 130 to 148; Zone 4, 148 to 167; and Zone 5, 167 to 185 beats per minute. Notice that the zones share their boundary numbers: 111 is both the top of Zone 1 and the bottom of Zone 2, and 130 is both the top of Zone 2 and the bottom of Zone 3. That is how the bands are defined, and it means a heart rate sitting exactly on a boundary belongs to both zones at once.
The second test adds a resting heart rate to the same person: a 35-year-old with a resting heart rate of 65 beats per minute, still using 220 minus age. The maximum is still 185, and the straight percentage zone is still 111 to 130. The heart rate reserve is 185 minus 65, which is 120 beats per minute. The Karvonen fat-burning zone is 60% of 120 plus 65, which is 72 plus 65, or 137; and 70% of 120 plus 65, which is 84 plus 65, or 149. So the Karvonen zone is 137 to 149 beats per minute, which sits 19 beats higher at the bottom and 19 beats higher at the top than the straight percentage zone. The gap comes from the resting heart rate: a low resting rate means a large reserve, and the Karvonen method gives more weight to that reserve. A fitter person with a lower resting rate gets a higher Karvonen zone than a less fit person of the same age.
The third test changes both the method and the person: a 40-year-old with a resting heart rate of 60, using the Tanaka formula. The maximum is 208 minus 0.7 times 40, which is 208 minus 28, or 180 beats per minute. The fat-burning zone is 60% to 70% of 180: 108 to 126 beats per minute. The heart rate reserve is 180 minus 60, which is 120, and the Karvonen zone is 60% of 120 plus 60, which is 132, to 70% of 120 plus 60, which is 144. So the Karvonen zone is 132 to 144 beats per minute. For this person the two methods give the same maximum, because 220 minus 40 is also 180, so the Tanaka and 220-minus-age answers agree exactly. That agreement does not hold at every age, as the by-age table below shows.
The fourth test shows the same 40-year-old’s five zones, all from the same maximum of 180: Zone 1, 90 to 108; Zone 2, 108 to 126; Zone 3, 126 to 144; Zone 4, 144 to 162; and Zone 5, 162 to 180 beats per minute. The Karvonen zone of 132 to 144 sits across the top half of Zone 2 and the bottom half of Zone 3, which is a useful reminder that the Karvonen zone and the percentage zones are two different ways of drawing the same map, and they do not line up exactly.
A fifth test uses a younger person and the Tanaka formula: a 28-year-old with a resting heart rate of 55. The Tanaka maximum is 208 minus 0.7 times 28, which is 208 minus 19.6, or 188.4, rounded to 188 beats per minute. The straight percentage zone is 60% to 70% of 188: 113 to 132 beats per minute. The heart rate reserve is 188 minus 55, which is 133, and the Karvonen zone is 60% of 133 plus 55, which is 79.8 plus 55, or 134.8, rounded to 135; and 70% of 133 plus 55, which is 93.1 plus 55, or 148.1, rounded to 148. So the Karvonen zone is 135 to 148 beats per minute. The rounding matters here: the unrounded figures 134.8 and 148.1 both round to the nearest whole beat, and the tool rounds halves up, so a figure ending in exactly .5 rounds up rather than down.
What is the fat-burning heart rate zone?
The fat-burning heart rate zone is the exercise intensity where the highest share of the calories burned during the session comes from fat rather than from carbohydrate. For most adults it sits at 60% to 70% of maximum heart rate, which is the range this tool works out. At that intensity the body draws mainly on stored fat for fuel, because fat is the fuel the body can supply steadily over a long effort, while carbohydrate is the fuel it calls on when the effort gets harder and faster.
The zone is a share, not a total. At 60% to 70% of maximum, fat supplies the largest proportion of the energy used, but the total amount of energy used per minute is modest, because the effort is light to moderate: brisk walking, a slow jog, easy cycling, or steady swimming. At higher intensities the share of energy from fat falls, because the body switches toward carbohydrate, but the total energy burned per minute rises sharply. That trade-off is the reason the zone is often misunderstood, and it is covered in its own section below.
The zone is also an estimate built on an estimate. Maximum heart rate is not measured by this tool; it is predicted from age, and the prediction is a population average. A person’s real maximum can sit 10 to 20 beats above or below the predicted figure, and the fat-burning zone moves with it. The only way to find a personal maximum is a graded exercise test with a chest strap or a lab measurement. The figures on this page are a starting point for planning, not a measurement of any one person’s body.
How is the fat-burning zone calculated?
There are three steps, and the tool does all of them. First, estimate maximum heart rate from age. Second, take 60% and 70% of that maximum. Third, if a resting heart rate is known, work out the Karvonen version from heart rate reserve as well.
The first step has two formulas. The standard formula is 220 minus age: a 35-year-old gets 220 minus 35, which is 185 beats per minute. It is the formula the American Heart Association chart uses, and it is the one most watches and treadmills use. The Tanaka formula is 208 minus 0.7 times age: a 35-year-old gets 208 minus 24.5, which is 183.5, rounded to 184 beats per minute. Tanaka was built from a meta-analysis of 351 studies covering 18,712 people, and it tends to give a slightly lower maximum for younger adults and a slightly higher one for older adults than 220 minus age does. At age 35 the two formulas differ by 1 beat per minute, and the zones differ by 1 beat at each end: 111 to 130 by 220 minus age, and 110 to 129 by Tanaka. At age 60 the gap is wider: 220 minus age gives a maximum of 160 and a zone of 96 to 112, while Tanaka gives a maximum of 166 and a zone of 100 to 116.
The second step is the same for both formulas: multiply the maximum by 0.60 for the lower end of the zone and by 0.70 for the upper end, then round each to the nearest whole beat. A 40-year-old with a maximum of 180 gets 108 to 126 beats per minute. A 20-year-old with a maximum of 200 gets 120 to 140. A 60-year-old with a maximum of 160 gets 96 to 112. The zone falls as age rises, because the maximum falls with age.
The third step is the Karvonen method, named after the Finnish physiologist Martti Karvonen, who described it in 1957. It starts from heart rate reserve, which is maximum heart rate minus resting heart rate. The target is then the chosen percentage of the reserve, plus the resting rate back on. For a 35-year-old with a resting rate of 65 and a maximum of 185, the reserve is 120, and the Karvonen zone is 60% of 120 plus 65, which is 137, to 70% of 120 plus 65, which is 149. The Karvonen method is the more personal of the two, because two people of the same age can have very different resting rates, and the method gives them different zones. A resting rate of 65 gives a Karvonen zone of 137 to 149 for a 35-year-old, while a resting rate of 80 would give a reserve of 105 and a zone of 143 to 154 for the same age and maximum.
What are the five heart rate training zones?
Heart rate training zones divide exercise intensity into five bands, each a 10% slice of maximum heart rate. The fat-burning zone is Zone 2, the second band. The table below shows the zones for a 35-year-old with a maximum of 185 beats per minute, worked out by the tool.
| Zone | Intensity | Heart rate (age 35, maximum 185) | What it is for |
|---|---|---|---|
| Zone 1 — Recovery | 50–60% of maximum | 93 to 111 bpm | Very light effort: warm-up, cool-down, recovery between harder sessions |
| Zone 2 — Fat Burn | 60–70% of maximum | 111 to 130 bpm | Light aerobic effort: the highest share of energy from fat, the base of endurance training |
| Zone 3 — Cardio | 70–80% of maximum | 130 to 148 bpm | Moderate effort: a mix of fat and carbohydrate, builds cardiovascular fitness |
| Zone 4 — Threshold | 80–90% of maximum | 148 to 167 bpm | Hard effort near the point where breathing gets laboured, mostly carbohydrate |
| Zone 5 — Maximum | 90–100% of maximum | 167 to 185 bpm | Maximum effort in short bursts only, almost entirely carbohydrate |
Zone 1 is the easiest band, where conversation is easy and the effort feels light. Zone 2 is the fat-burning zone, where the effort is still comfortable enough to hold a conversation in full sentences, and where most long, steady sessions are done. Zone 3 is the band where breathing deepens and full sentences get shorter. Zone 4 is hard effort, where only short phrases come out. Zone 5 is all-out effort that can only be held for a short time. The talk test is a practical check on which zone you are in: if you can talk in full sentences, you are probably in Zone 1 or 2; if you can only manage a few words at a time, you are probably in Zone 4 or 5.
The American Heart Association describes the same ground in two broader bands: moderate intensity at 50% to 70% of maximum heart rate, which covers Zones 1 and 2, and vigorous intensity at 70% to 85%, which covers Zone 3 and the lower part of Zone 4. The five-zone split is the finer version of the same idea, and it is the version most training watches and running plans use.
What is the fat-burning zone by age?
The table below gives the estimated maximum heart rate and the fat-burning zone for ages 20 to 60, by both formulas. Every figure was computed with the tool’s own arithmetic. The 220-minus-age column is the standard figure; the Tanaka column is the alternative.
| Age | Maximum heart rate (220 minus age) | Fat-burning zone (220 minus age) | Maximum heart rate (Tanaka) | Fat-burning zone (Tanaka) |
|---|---|---|---|---|
| 20 | 200 bpm | 120 to 140 bpm | 194 bpm | 116 to 136 bpm |
| 30 | 190 bpm | 114 to 133 bpm | 187 bpm | 112 to 131 bpm |
| 40 | 180 bpm | 108 to 126 bpm | 180 bpm | 108 to 126 bpm |
| 50 | 170 bpm | 102 to 119 bpm | 173 bpm | 104 to 121 bpm |
| 60 | 160 bpm | 96 to 112 bpm | 166 bpm | 100 to 116 bpm |
Two patterns in the table are worth reading. First, the zone falls by roughly 5 to 6 beats per decade at each end: the lower end goes from 120 at age 20 to 96 at age 60, and the upper end from 140 to 112. Second, the two formulas cross at age 40, where both give a maximum of 180 and a zone of 108 to 126. Below 40, Tanaka gives a lower maximum than 220 minus age; above 40, Tanaka gives a higher one. At age 20 the gap is 6 beats at the maximum and 4 beats at each end of the zone; at age 60 it is 6 beats at the maximum and 4 beats at each end in the other direction. The choice of formula changes the answer by a few beats either way, which is smaller than the error of either formula against a measured maximum.
To see what a heart rate means as a share of your maximum, the percentage calculator gives the figure: 120 out of 185 is 64.9%, 120 out of 180 is 66.7%, and 120 out of 160 is 75.0%.
Does exercising in the fat-burning zone burn more body fat?
This is the question that causes the most confusion, and the answer has two parts that point in different directions. In the fat-burning zone, the highest share of the calories burned during the session comes from fat. That part is true, and it is why the zone has its name. But burning a higher share of fat during a session is not the same as losing more body fat over time, and that part is where the zone is often oversold.
The reason is total energy. A 30-minute session in Zone 2 might burn 300 calories, of which roughly 65% come from fat, or about 195 calories from fat. A 30-minute session at a higher intensity might burn 500 calories, of which only about 35% come from fat, or about 175 calories from fat. In that comparison the Zone 2 session burns slightly more fat calories during the session itself. But the higher-intensity session burns 200 more calories in total, and body fat over weeks and months follows total energy balance, not the fuel mix of any single session. A 2021 review in Frontiers in Physiology found no support for the idea that burning a higher share of fat during a session, on its own, leads to losing more body fat over time.
The zone still has real uses. Long, steady sessions in Zone 2 build the aerobic base that endurance depends on, and they are easier to recover from than hard sessions, so they can be done more often. For someone building up fitness from a low base, Zone 2 is the intensity that can be held for 30 to 60 minutes without stopping. What the zone does not do is guarantee fat loss: that depends on total energy over time, on food as well as on exercise, and on a routine that can be repeated week after week. Body mass index is a separate measure from heart rate, and the BMI calculator works it out from height and weight.
Is 120 bpm in the fat-burning zone?
It depends on age, because the zone falls as age rises. For a 40-year-old, the fat-burning zone is 108 to 126 beats per minute, so 120 sits inside it, at 66.7% of the maximum of 180. For a 25-year-old, the zone is 117 to 137 beats per minute, so 120 sits inside it too, near the lower end, at 61.5% of the maximum of 195. For a 20-year-old, the zone is 120 to 140 beats per minute, so 120 sits exactly on the lower edge. For a 60-year-old, the zone is 96 to 112 beats per minute, so 120 sits above it, at 75.0% of the maximum of 160, which is in Zone 3 rather than Zone 2.
The same number can therefore mean three different things for three different people. A single target heart rate taken from an article or a friend is not a personal zone: the zone has to be worked out from the person’s own age, and from their resting heart rate if the Karvonen method is used. That is what the tool on this page does, and it is why the worked examples above show the arithmetic instead of giving one number to remember.
How do I measure my resting heart rate?
Resting heart rate is the number of times the heart beats in a minute while the body is fully at rest. The usual way to measure it is first thing in the morning, before getting out of bed, while still lying down. Count the beats for a full 60 seconds, or count for 30 seconds and double the number. A chest strap gives a steadier reading than a wrist sensor, and a wrist sensor is more reliable at rest than at high intensity.
For most adults the resting rate sits between 60 and 100 beats per minute. A lower resting rate is common in people who train regularly, because a fitter heart pumps more blood with each beat and needs fewer beats to do the same work. A resting rate can also be higher than usual after a poor night’s sleep, during illness, or after caffeine, so a single morning’s reading is less useful than an average over several mornings. If the resting rate is entered in the tool, it is worth measuring it the same way on a few mornings and using the typical figure.
What affects maximum heart rate?
Age is the main factor, and it is the only one the formulas use: maximum heart rate falls as age rises, by about 1 beat per minute per year under 220 minus age, and by 0.7 beats per minute per year under Tanaka. Fitness level does not change the maximum much: a trained person and an untrained person of the same age usually have similar maximums, even though their resting rates are very different.
Medicines can change it. Beta blockers, which are prescribed for high blood pressure and some heart conditions, can keep the heart rate from reaching a standard target, and other medicines can lower the maximum as well. That is one reason the zones on this page are estimates: a person taking such a medicine may never reach the predicted maximum, and the predicted zones would then sit too high. The page says this plainly in the limits section below, and anyone taking medicine that affects heart rate should talk to a clinician before training.
Individual variation is the other factor. Published checks put the error of the age-predicted formulas at roughly 7 to 11 beats per minute, and some people’s real maximums sit 15 to 20 beats above or below any formula’s prediction. In one study of 36 relatively fit runners, each person’s peak fat-burning intensity ranged widely, averaging between 67.6% and 87.1% of maximum heart rate. That spread is the reason the zone is a planning range and not a personal measurement: the formulas describe an average person, and no single reader is exactly average.
What are the limits of this calculator?
This calculator estimates maximum heart rate from age, and every zone on the page follows from that estimate. The estimate is a population average, and published checks put its error at roughly 7 to 11 beats per minute. A person’s real maximum, and therefore their real fat-burning zone, can sit well above or below the figure shown. The only way to find a personal maximum is a graded exercise test, and the only way to find a personal peak fat-burning intensity is a lab test that measures the gases breathed out.
The 60% to 70% band is a convention, not a sharp threshold. Fat burning does not switch on at 60% and switch off at 70%: the share of energy from fat falls gradually as intensity rises, and the curve rolls off through the 70s and into the 80s. Some published work puts the peak fat-burning intensity higher than 70% for trained people. The tool uses 60% to 70% because it is the band the American Heart Association chart and most calculators use, and because it is the band the supporting keywords for this page ask about.
The tool does not measure heart rate, record a result, or store anything: everything runs in the browser, and nothing is uploaded. It does not give medical advice or fitness advice, and it does not say whether a person should exercise at a given intensity or how to train. It does not take account of medicines, heart conditions, or any other health factor.
Is this page medical advice?
No. The figures on this page are general information about a published fitness calculation. They are not medical advice, and they are not a recommendation to exercise at any intensity. The zones are general estimates built on population averages, and they do not describe any one person’s body.
People with a heart condition should talk to a clinician before training, and so should anyone taking medicine that affects heart rate, anyone who has been told to limit exercise, and anyone who feels chest pain, breathlessness, dizziness or faintness during exercise. A clinician, or a qualified exercise professional working with one, is the right person to judge what intensity is suitable for an individual. This page cannot do that, and it does not try to.
How can I check the tool against a known result?
The simplest check uses the first test. Enter age 35, choose 220 minus age, and leave the resting heart rate blank. The tool should show a maximum heart rate of 185 beats per minute, a fat-burning zone of 111 to 130 beats per minute, and five zones of 93 to 111, 111 to 130, 130 to 148, 148 to 167, and 167 to 185 beats per minute. The note should say the maximum comes from 220 minus 35.
A second check tests the Karvonen method. Enter age 35, choose 220 minus age, and enter a resting heart rate of 65. The tool should add a heart rate reserve of 120 beats per minute and a Karvonen fat-burning zone of 137 to 149 beats per minute, while the straight percentage zone stays at 111 to 130.
A third check tests the Tanaka formula. Enter age 40, choose Tanaka, and enter a resting heart rate of 60. The tool should show a maximum of 180 beats per minute, a fat-burning zone of 108 to 126, a heart rate reserve of 120, and a Karvonen zone of 132 to 144 beats per minute.
A fourth check tests the errors. Enter an age of 0 and the tool should show the error “The age must be at least 1.” with no results. Enter age 35 with a resting heart rate of 200 and the tool should show the error “The resting heart rate must be below your estimated maximum heart rate of 185 beats per minute.” with no results. Leave the age blank and the tool should show the error “Please enter your age in years.” with no results.
More tools in the same collection are in the calculators category.
Frequently asked questions
What is the fat-burning heart rate zone?
The fat-burning heart rate zone is 60% to 70% of your estimated maximum heart rate, the intensity where the highest share of the calories burned during exercise comes from fat. For a 35-year-old with a maximum of 185 beats per minute, the zone is 111 to 130 beats per minute. It is a general estimate, not a personal measurement.
How do I calculate my fat-burning heart rate?
Subtract your age from 220 to estimate your maximum heart rate, then take 60% and 70% of that figure. A 40-year-old gets a maximum of 180 beats per minute and a zone of 108 to 126. The Tanaka formula, 208 minus 0.7 times age, gives an alternative maximum. If you know your resting heart rate, the Karvonen method works the zone out from heart rate reserve instead: maximum minus resting, times 60% and 70%, plus resting.
What are the five heart rate training zones?
Zone 1, Recovery, is 50% to 60% of maximum; Zone 2, Fat Burn, is 60% to 70%; Zone 3, Cardio, is 70% to 80%; Zone 4, Threshold, is 80% to 90%; and Zone 5, Maximum, is 90% to 100%. For a 35-year-old with a maximum of 185 beats per minute, the zones are 93 to 111, 111 to 130, 130 to 148, 148 to 167, and 167 to 185 beats per minute.
Is 120 bpm in the fat-burning zone?
It depends on age. For a 40-year-old the zone is 108 to 126 beats per minute, so 120 sits inside it. For a 25-year-old the zone is 117 to 137, so 120 sits inside it near the lower end. For a 20-year-old the zone is 120 to 140, so 120 sits exactly on the lower edge. For a 60-year-old the zone is 96 to 112, so 120 sits above it, in Zone 3.
Does exercising in the fat-burning zone burn the most body fat?
Not necessarily. The zone burns the highest share of calories from fat during the session, but higher intensities burn more total calories per minute, and body fat over time follows total energy balance. A 2021 review in Frontiers in Physiology found no support for the idea that burning a higher share of fat during a session, on its own, leads to losing more body fat over time. The zone is still useful for long, steady sessions that build aerobic fitness and are easy to recover from.
What is the Karvonen method?
The Karvonen method works out a target heart rate from heart rate reserve, which is maximum heart rate minus resting heart rate. The target is the chosen percentage of the reserve plus the resting rate. For a 35-year-old with a resting rate of 65 and a maximum of 185, the reserve is 120, and the Karvonen fat-burning zone is 60% of 120 plus 65, which is 137, to 70% of 120 plus 65, which is 149 beats per minute. It is the more personal method, because it takes account of resting heart rate.