UPS Retirement Calculator
Enter the monthly pension benefit, the number of years the payments are expected to run, and an annual discount rate. The tool shows the present value of the pension as a lump-sum estimate, the total of the payments without discounting, the amount discounting removes, and the break-even years after which the monthly payments add up to more than the lump sum.
This calculator is not affiliated with, endorsed by, or connected to UPS (United Parcel Service). It is a generic pension valuation tool. It estimates the present value of any monthly pension benefit for anyone comparing a lump sum with monthly payments, including UPS retirees. It uses no UPS branding, no UPS logo, and no UPS pension plan details.
The present value is the lump-sum estimate: the single amount today that is worth the same as the whole stream of monthly payments at the rate you entered. The break-even years are the present value divided by one year of pension payments. The tool assumes the payments are level (the same amount every month), arrive at the end of each month, and run for exactly the number of years entered. It does not model cost-of-living increases, survivor benefits, taxes, or the chance of living longer or shorter than the years entered.
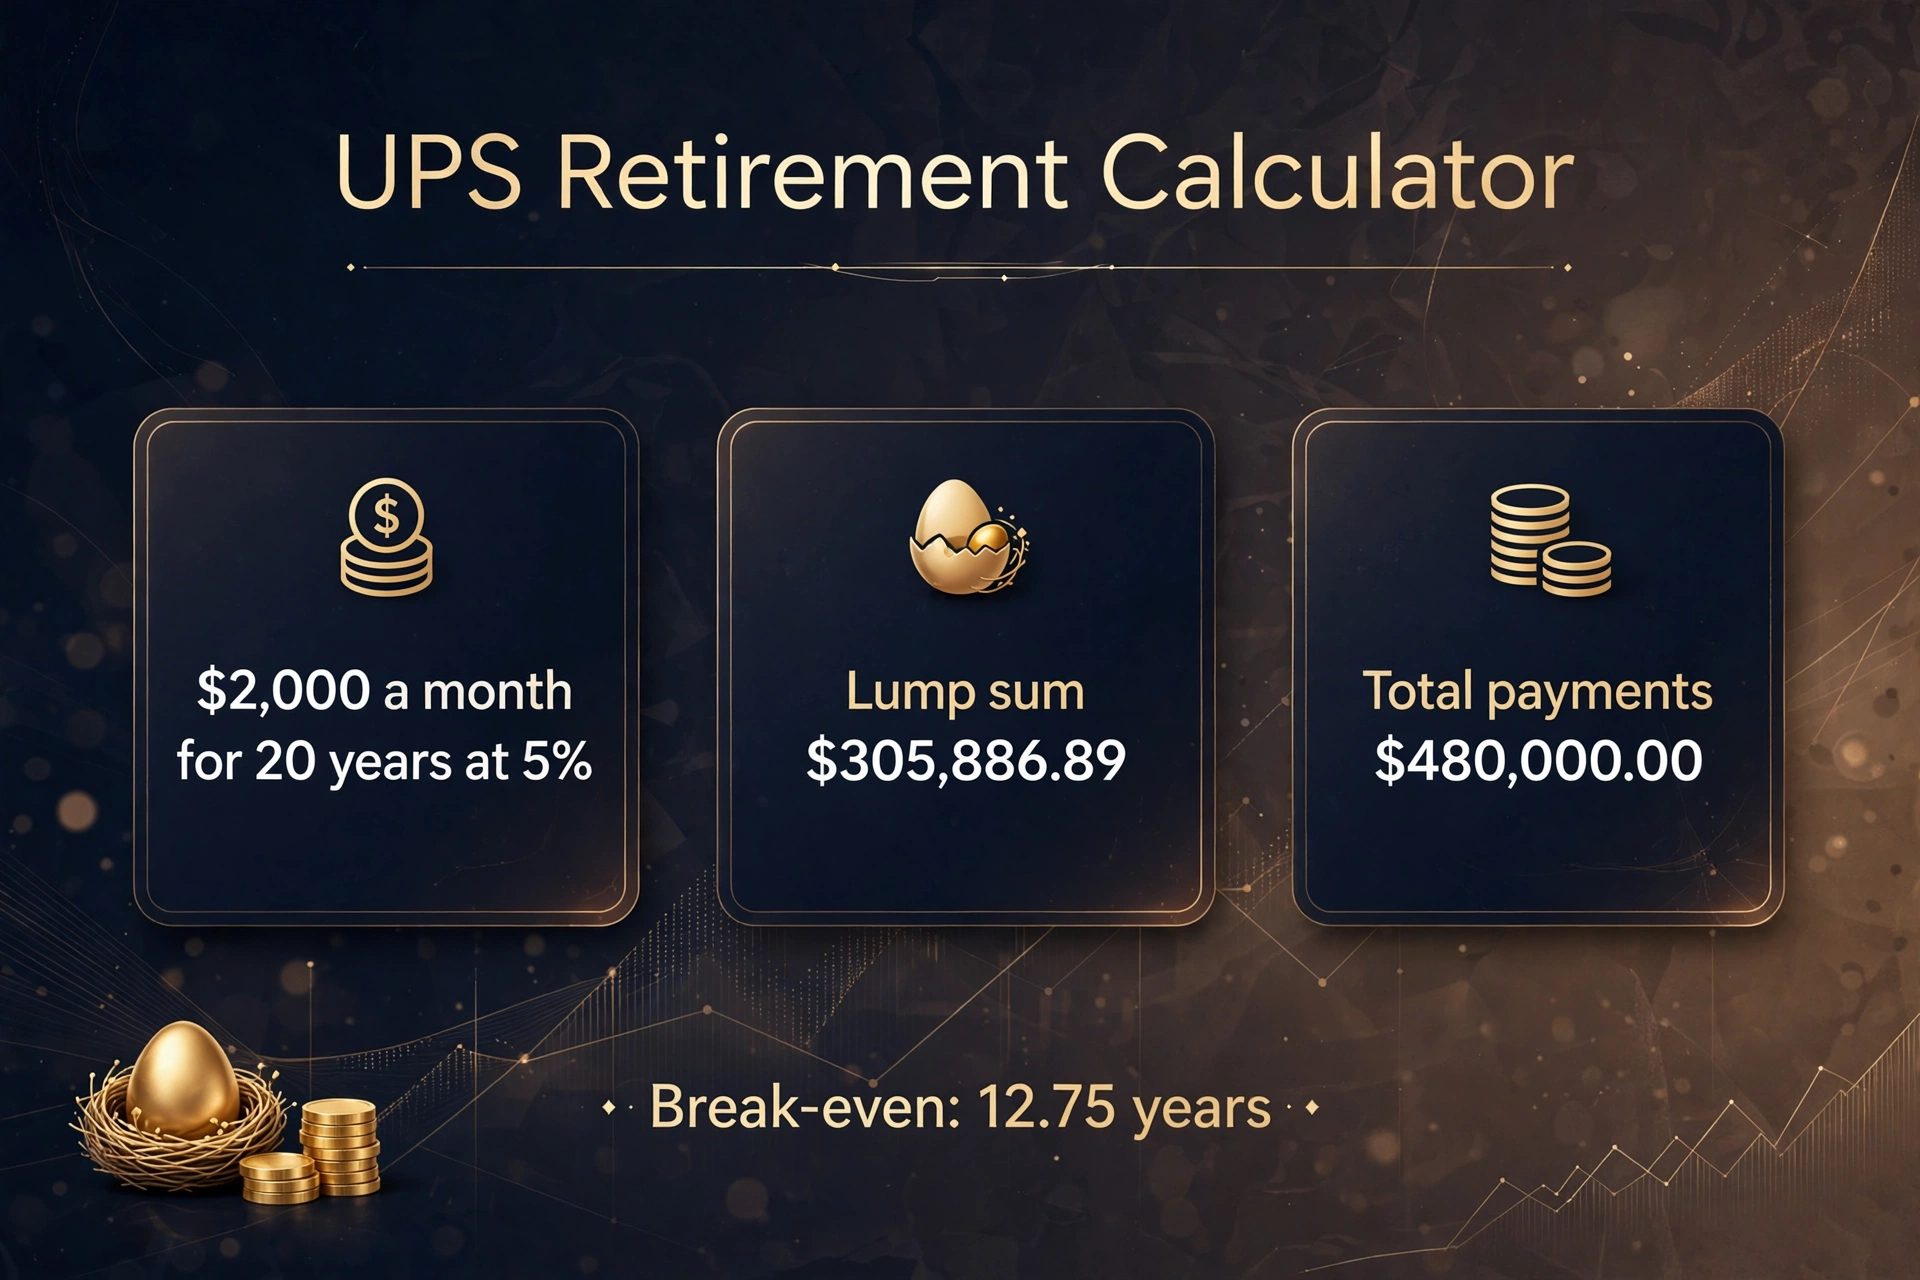
A $2,000 monthly pension paid for 20 years is worth $305,886.89 today at a 5% discount rate. This calculator turns any monthly pension into that single present-value figure, so a lump sum and a monthly pension can be compared on the same terms.
This calculator is not affiliated with, endorsed by, or connected to UPS (United Parcel Service). It is a generic pension valuation tool. It estimates the present value of a monthly pension benefit for anyone comparing a lump sum with monthly payments, including UPS retirees. It uses no UPS branding, no UPS logo, and no UPS pension plan details, and it gives general information only, not financial or retirement advice.
How do I use the UPS Retirement Calculator?
Enter the monthly pension benefit in the first box. That is the amount the pension pays each month, before tax, as shown on a benefit statement or election form. The first verified test uses $2,000 a month. The box accepts cents, so $2,437.50 goes in as 2437.50.
Enter the number of years of payments in the second box. That is the horizon over which the payments are expected to run — for example, the years from the start of the pension to the age used for planning. The tool accepts half years, so 18.5 is allowed, and it counts 12 payments per year. The first verified test uses 20 years, which is 240 monthly payments.
Enter the annual discount rate in the third box, as a percentage. The rate is the return money could earn elsewhere at comparable risk, and it is the single input that moves the answer most. The first verified test uses 5%. A rate of 0 is allowed and gives a present value equal to the total of the payments, because money that earns nothing loses nothing by arriving later.
Press the calculate button and four labelled boxes appear. The first box is the present value, the lump-sum estimate: the single amount today worth the same as the whole stream of monthly payments at the rate entered. The second box is the total of the payments without discounting: the monthly benefit multiplied by the number of payments. The third box is the amount discounting removes: the total minus the present value. The fourth box is the break-even years: the present value divided by one year of pension payments. Under the boxes, a note gives the present value as a percentage of the total, and repeats the break-even years in plain words.
If an input is wrong, the tool shows a plain-language error and no results. A monthly benefit of 0 or a negative benefit is rejected, because a pension needs a benefit above $0. A benefit above $1,000,000 a month is rejected as outside the range the tool covers. Years below 1 or above 50 are rejected, because the tool covers horizons from 1 to 50 years. A rate below 0 is rejected, and a rate above 30 is rejected, because no planning discount rate for a pension runs above 30%.
What does a worked example look like?
Start with the first verified test. A monthly pension of $2,000, paid for 20 years, at a 5% annual discount rate. The monthly rate is 1.05^(1/12) − 1 = 0.004074, which is 0.4074% a month. There are 20 × 12 = 240 payments. The annuity factor is (1 − 1.004074^−240) ÷ 0.004074 = (1 − 0.376889) ÷ 0.004074 = 0.623111 ÷ 0.004074 = 152.9434. The present value is $2,000 × 152.9434 = $305,886.89. The total of the payments without discounting is $2,000 × 240 = $480,000.00. Discounting removes $480,000.00 − $305,886.89 = $174,113.11. The break-even years are $305,886.89 ÷ $24,000 = 12.75 years. The lump sum is 63.73% of the total the pension would pay.
A second test uses a larger benefit over a longer horizon at a lower rate. A monthly pension of $3,000, paid for 25 years, at a 4% annual discount rate. The monthly rate is 1.04^(1/12) − 1 = 0.003274. There are 25 × 12 = 300 payments. The annuity factor is (1 − 1.003274^−300) ÷ 0.003274 = (1 − 0.375117) ÷ 0.003274 = 0.624883 ÷ 0.003274 = 190.8775. The present value is $3,000 × 190.8775 = $572,632.44. The total of the payments is $3,000 × 300 = $900,000.00. Discounting removes $900,000.00 − $572,632.44 = $327,367.56. The break-even years are $572,632.44 ÷ $36,000 = 15.91 years. The lump sum is 63.63% of the total.
A third test uses a shorter horizon at a higher rate. A monthly pension of $2,500, paid for 18 years, at a 6% annual discount rate. The monthly rate is 1.06^(1/12) − 1 = 0.004868. There are 18 × 12 = 216 payments. The annuity factor is (1 − 1.004868^−216) ÷ 0.004868 = (1 − 0.350344) ÷ 0.004868 = 0.649656 ÷ 0.004868 = 133.4668. The present value is $2,500 × 133.4668 = $333,666.90. The total of the payments is $2,500 × 216 = $540,000.00. Discounting removes $540,000.00 − $333,666.90 = $206,333.10. The break-even years are $333,666.90 ÷ $30,000 = 11.12 years. The lump sum is 61.79% of the total.
A fourth test uses a smaller benefit at a low rate. A monthly pension of $1,500, paid for 15 years, at a 3% annual discount rate. The monthly rate is 1.03^(1/12) − 1 = 0.002466. There are 15 × 12 = 180 payments. The annuity factor is (1 − 1.002466^−180) ÷ 0.002466 = (1 − 0.641862) ÷ 0.002466 = 0.358138 ÷ 0.002466 = 145.2145. The present value is $1,500 × 145.2145 = $217,821.70. The total of the payments is $1,500 × 180 = $270,000.00. Discounting removes $270,000.00 − $217,821.70 = $52,178.30. The break-even years are $217,821.70 ÷ $18,000 = 12.10 years. The lump sum is 80.67% of the total, which is higher than in the other tests because the rate is lower and the horizon is shorter, so discounting takes less.
A fifth test is the zero-rate edge case. A monthly pension of $2,000, paid for 20 years, at a 0% discount rate. The present value is $480,000.00, which is exactly the total of the payments, and discounting removes $0.00. The break-even years are 20.00, the full horizon. That is the correct result: with no return on money held today, a dollar in twenty years is worth a dollar today.
What is the present value of a pension?
The present value of a pension is the single amount today that is worth the same as the whole stream of future monthly payments. It answers one question: how much money would you need in hand now, invested at the discount rate, to produce exactly those monthly payments for exactly that many years? That figure is the lump-sum estimate, and it is the only figure that lets a lump sum and a monthly pension be compared directly, because it puts both offers in today’s dollars.
The idea behind it is the time value of money: a dollar today is worth more than a dollar in twenty years, because today’s dollar can be put to work. Each future payment is therefore worth less than its face value today, and the further away a payment sits, the less it is worth. The first payment, arriving next month, is worth almost its full amount. The last payment, arriving in twenty years, is worth a fraction of it. The present value is the sum of all those shrunken payments.
For a typical retiree expecting $2,000 a month, that figure lands between about $250,000 and $400,000 depending on the rate and the horizon, as the guides this article draws on point out. At 5% over 20 years it is $305,886.89. At 3% over the same 20 years it is $361,942.76, and at 7% it is $262,314.09. The pension did not change in any of those runs. Only the rate changed, and the rate moved the value by nearly $100,000. That is why a present value quoted without its rate and term is only half an answer.
How is the present value of a monthly pension calculated?
The formula discounts every monthly payment back to today and adds the results. For a monthly benefit PMT, a monthly discount rate r, and n monthly payments, the present value is PMT × [(1 − (1 + r)^−n) ÷ r]. The bracketed part is called the annuity factor. It is the present value of $1 a month for n months at rate r, and multiplying it by the monthly benefit gives the present value of the whole pension.
The monthly rate is not the annual rate divided by 12. It is the rate that compounds to the annual figure over twelve months: monthly rate = (1 + annual rate)^(1/12) − 1. At a 5% annual rate the monthly rate is 0.4074%, while 5 ÷ 12 would give 0.4167%. The difference looks small, but it compounds over 240 payments, and using the divided rate would overstate the present value. This tool converts the rate properly, and the worked examples above show the converted rate in each case.
A simpler annual version of the same formula is widely quoted: PV = Annual Payment × [(1 − (1 + r)^−n) ÷ r], with n in years. For $30,000 a year for 20 years at 5%, that gives $30,000 × 12.4622 = $373,866.31, which matches the figure of about $373,900 quoted in the guides. The annual version is a useful check, but it treats each year’s payments as if they arrived in one lump at year end. The monthly version this tool uses discounts each month separately, which is the closer match to a pension that actually pays monthly.
One more check keeps the answer honest. The present value can never pass the perpetuity ceiling: the annual pension divided by the discount rate. For $24,000 a year at 5%, that ceiling is $24,000 ÷ 0.05 = $480,000.00. No finite term can be worth more than payments that never stop. The first test’s $305,886.89 sits well below that ceiling, as it should for a 20-year term. A result above the ceiling would mean something went wrong.
What is the break-even point between a lump sum and monthly payments?
The break-even point is the number of years of monthly payments that add up to the lump sum. Divide the lump sum by one year of pension payments. A $300,000 lump sum against $24,000 a year breaks even after 12.5 years. If payments start at 65, that is about age 77½. Collect for fewer years than that and the lump sum paid more in total. Collect for longer and the monthly pension paid more.
This tool reports a second, discounted break-even figure: the present value divided by one year of payments. For the first test, $305,886.89 ÷ $24,000 = 12.75 years. The two figures answer different questions. The undiscounted break-even of 12.5 years says when the cheques add up to the lump sum. The discounted break-even of 12.75 years says when the present value of the cheques reaches the lump sum. Both are worth knowing, and the tool’s note gives the discounted one because the tool’s headline figure is the present value.
Whether the break-even age is reached depends on how long the payments actually run, and that is a question about life expectancy, not arithmetic. The Social Security Administration’s 2023 period life table, used in the 2026 Trustees Report, gives a 65-year-old man 18.12 more years on average and a 65-year-old woman 20.66 more years. Those are population averages. A person in good health at 65 with long-lived parents should plan on a longer horizon than the average, and a person in poor health on a shorter one. The tool takes the years you enter and does not guess them for you, so the horizon you choose is doing real work in the answer. The quick-reference table below shows how the same pension changes value as the horizon moves from 15 to 30 years.
Is a lump sum or monthly pension better?
Neither choice is better in general. The monthly pension usually comes out ahead if the payments are collected past the break-even age, because it also gives income that cannot be outlived: the payments keep arriving for as long as the retiree lives, however long that turns out to be. The lump sum usually fits better if health is poor, if other guaranteed income already covers the basics, or if leaving money to heirs matters, because the lump sum can be passed on while the monthly payments normally stop at death unless a survivor benefit was chosen.
Three numbers settle most of the comparison. The first is the break-even age, which this tool gives. The second is the return the pension implies: the rate the lump sum would have to earn to match the pension over the expected horizon. The third is the income the lump sum could support: the monthly amount it could pay for the same horizon. If the lump sum can be invested at a return above the pension’s implied rate, the lump sum wins on the maths. If it cannot, the pension wins. The tool’s present value is the starting point for all three, because the implied return is the rate at which the present value of the pension equals the lump-sum offer.
The comparison also has parts the arithmetic does not capture. Taxes can differ between the two paths: a lump sum taken as cash is usually taxed as ordinary income in the year it arrives, while monthly payments are taxed as they arrive, and a lump sum rolled into an IRA is taxed differently again. A survivor benefit reduces the monthly payment — commonly by about 10 to 15% for a 50% survivor benefit and 15 to 20% for a 100% survivor benefit — in exchange for payments continuing to a spouse. The employer’s plan may be insured by the Pension Benefit Guaranty Corporation, which guarantees most private-sector defined-benefit pensions up to limits that change each year. And the pension election is usually irrevocable: once the choice is made, it cannot be changed. This page gives general information about the maths, not financial or retirement advice, and a decision of this size belongs with the plan’s own documents and a qualified adviser.
How does the discount rate change the answer?
The discount rate is the engine of the whole calculation. A higher rate shrinks the present value; a lower rate inflates it. The first test’s pension is worth $361,942.76 at 3%, $332,105.23 at 4%, $305,886.89 at 5%, $282,768.62 at 6%, and $262,314.09 at 7%. Moving from 3% to 7% cuts the value by $99,628.67, which is more than a quarter of the 3% figure, while the pension itself never changed.
The rate should match what the money could actually earn elsewhere at comparable risk. For a guaranteed pension payment, a safe rate such as a government bond yield is the natural comparison. For money that would go into a stock market fund, a higher rate reflects the higher expected return and the higher risk. Using a mortgage rate, or an inflation rate, for a fixed nominal pension mixes up two different things and gives a misleading answer. The honest approach is to run the calculation at two or three rates and see whether the decision survives the range. If the lump sum only wins at the most optimistic rate, that is a warning, not a plan.
The rate also decides how much of the total the discounting removes. At 3% over 20 years, discounting removes $118,057.24 of the $480,000.00 total, leaving 75.40% of it. At 7%, it removes $217,685.91, leaving only 54.65%. At the extreme, a 30% rate leaves a $2,000 monthly pension for 20 years worth only $90,003.43, which is 18.75% of the total. The longer the horizon, the harder the rate bites, because each additional year multiplies every later payment by the same shrinking factor. That is why a one-point change in the rate matters far more over 30 years than over 5.
What does the IRS say about pension lump sums?
For private-sector pension plans in the United States, federal law sets the floor for lump sums. Section 417(e) of the Internal Revenue Code requires plans to calculate a lump sum using prescribed interest rates and a prescribed mortality table. The interest rates are three segment rates, each applied to a different slice of the payment timeline: the first segment rate covers payments in the first five years, the second covers years six through twenty, and the third covers everything beyond twenty years. The IRS publishes updated segment rates each month. The rates published for January 2026 were 4.03% for the first segment, 5.20% for the second, and 6.12% for the third, under IRS Notice 2026-14, as reported by LegalClarity’s guide to how the IRS 417(e) rates affect lump-sum payouts.
Two things follow from that. First, the lump sum a plan offers is a formula, not a negotiation: the plan must use its prescribed rates and mortality table, and the rates it uses depend on its own lookback month, so the same pension can carry a different lump sum at different times of year. Second, when segment rates rise, lump sums fall, and when they fall, lump sums rise. That is the same inverse relationship this tool shows: a higher discount rate gives a lower present value. This tool uses one rate entered by the reader rather than the three segment rates, so its figure is an estimate for comparison, not the figure a plan would offer. The plan’s own figure, worked out under Section 417(e), is the one that governs an actual election, and it is the figure to compare this tool’s estimate against.
The mortality side of the same rule matters just as much. The IRS publishes updated static mortality tables each year, and the 2026 version appears in Notice 2025-40. Those tables assign a probability of survival to each age, and a full valuation weights every monthly payment by the likelihood of being alive to collect it. This tool does not do that weighting: it discounts a fixed number of years of payments, which is simpler and easier to check, but it is not the plan’s method. A reader who wants the plan’s method should ask the plan for its lump-sum figure and the rates and table it used.
What is the difference between this tool and the Unified Pension Scheme calculators?
The search results for “ups retirement calculator” are dominated by calculators for India’s Unified Pension Scheme, which is a different UPS entirely. That scheme covers Indian central government employees, and its assured payout is 50% of the average basic pay of the last 12 months after 25 years of qualifying service, with a minimum of ₹10,000 a month after 10 years and a family payout of 60%. This page does not model that scheme. It does not use its formulas, its rupee figures, or its service rules, and it is not a calculator for Indian government employees working out their assured payout.
This page answers the other meaning of the search: a generic present-value tool for a monthly pension, for anyone weighing a lump sum against monthly payments, including retirees of UPS, the delivery company. The only UPS fact on this page is the statement that this tool is not affiliated with, endorsed by, or connected to that company. If you searched for the Indian Unified Pension Scheme, this page is not the tool you need, and the calculators at the top of the search results for that phrase are the ones built for it.
What mistakes do people commonly make when valuing a pension?
The first mistake is comparing the lump sum with the undiscounted total. A $300,000 lump sum looks small next to $480,000.00 of total payments, but the total counts dollars arriving over twenty years as if they were dollars in hand today. Discounted at 5%, those payments are worth $305,886.89, which is only $5,886.89 above the $300,000 offer. The fair comparison is always lump sum against present value, never lump sum against the total.
The second mistake is using the annual rate as a monthly rate. Dividing 5% by 12 gives 0.4167% a month, while the true monthly equivalent is 0.4074%. The divided rate overstates the present value, because it discounts each payment slightly less than it should. Over 240 payments the error adds up. This tool converts the rate properly, and the worked examples show the converted rate.
The third mistake is choosing the horizon from the average life expectancy and treating it as a promise. A 65-year-old man lives 18.12 more years on average, but the average includes people who die at 66 and people who live to 100. Planning to the average and then living five years longer leaves five years of payments uncounted. Run the calculation at a longer horizon too, and see how the answer moves: the same $2,000 pension is worth $254,770.32 over 15 years, $305,886.89 over 20, $345,938.05 over 25, and $377,319.19 over 30, all at 5%.
The fourth mistake is ignoring the survivor benefit. A single-life pension pays more each month than a joint-and-survivor pension, because the payments stop at one death instead of two. Comparing a lump sum with the single-life monthly figure, when the retiree actually needs the survivor version, overstates the pension. Enter the monthly benefit that matches the option actually being chosen, not the highest figure on the form.
The fifth mistake is forgetting tax. A lump sum taken as cash is usually taxed as ordinary income in the year it arrives, which can push it into a higher bracket, while monthly payments spread the tax across the years they arrive. A lump sum rolled into an IRA is taxed differently again. This tool shows figures before tax, so treat the comparison as a starting point and check the tax rules that apply to the actual choice. The take home pay calculator shows how tax rates change what actually reaches a bank account each period.
The sixth mistake is treating the lump sum as free money. The lump sum has to be invested and managed, and it can run out. The monthly pension cannot run out while the retiree lives. That difference is worth something, and it is not in the present value at all: it is the value of never having to worry about outliving the money.
What are the limits of this calculator?
This calculator values a level monthly pension over a fixed number of years at one fixed discount rate. It does not model cost-of-living increases, so a pension that rises each year is worth more than the figure shown here. It does not model survivor benefits, so enter the monthly benefit for the option actually being chosen. It does not weight payments by survival probability, as the IRS Section 417(e) method does, and it does not use the three segment rates a plan uses, so its figure is an estimate for comparison, not the figure a plan would offer.
It does not handle taxes, fees, or inflation separately. If the pension payments are taxed on receipt, discount the after-tax figure, or compare the lump sum and the pension on the same after-tax basis. It does not model the investment return on a lump sum once it is taken, the risk of that return, or the chance that the money runs out. To see what a lump sum would grow into if it were invested, the compound interest calculator works out the growth of a single sum over time.
It treats the rate as known and fixed, while real rates drift, and the longer the horizon, the more the answer is a model of a rate assumption rather than a fact about the world. It covers horizons from 1 to 50 years, monthly benefits up to $1,000,000, and rates from 0% to 30%. The figures it gives are estimates for comparing options. They are not a valuation of a specific plan, and this page gives general information about pension valuation, not financial or retirement advice. A decision about an actual pension election belongs with the plan’s own documents, the plan’s lump-sum figure, and a qualified adviser. This calculator is not affiliated with, endorsed by, or connected to UPS, and it uses no UPS pension plan details, because it has none: it is a generic tool, and any UPS-specific plan terms must come from the plan itself.
How can I check the tool against a known figure?
The simplest check uses the first verified test. Enter a monthly pension of $2,000, years of 20, and a rate of 5%. The tool should show a present value of $305,886.89, total payments of $480,000.00, discounting removing $174,113.11, and break-even years of 12.75, with the note “The lump sum is 63.73% of the $480,000.00 the pension would pay in total. Payments equal the lump sum after 12.75 years: collect longer than that and the monthly payments add up to more.” Every box should match.
A second check uses the zero rate. Enter $2,000, 20 years, and a rate of 0. The tool should show a present value of $480,000.00, total payments of $480,000.00, discounting removing $0.00, and break-even years of 20.00. A third check uses the larger benefit: enter $3,000, 25 years, and a rate of 4%. The tool should show a present value of $572,632.44, total payments of $900,000.00, discounting removing $327,367.56, and break-even years of 15.91. A fourth check tests the errors: enter a monthly benefit of 0 and the tool should show the error “The monthly pension benefit must be above $0.” with no results, and enter a rate of 31 and the tool should show the error “The discount rate cannot be above 30.” with no results.
The formula behind the tool is the standard present value of an annuity, set out in LegalClarity’s guide to how to calculate the present value of a pension, which gives the formula with a worked example, and in AgentCalc’s pension lump sum vs annuity calculator, which explains the monthly conversion of the annual rate and the break-even rule. The break-even example of $2,000 a month against a $300,000 lump sum follows Boldin’s pension lump sum vs annuity guide, which gives the 12.5-year undiscounted break-even and the life-expectancy figures from the Social Security Administration’s life table. The life-expectancy figures in this article come from the Social Security Administration’s actuarial life table, the 2023 period life table used in the 2026 Trustees Report. To value a single future sum rather than a stream of payments, the present value of money calculator discounts one amount at one rate. More tools in the same collection are in the calculators category.
How much is a $2,000 monthly pension worth at common rates?
Every figure in this table was computed from the same formula the tool uses: monthly rate = (1 + annual rate)^(1/12) − 1, then PV = monthly benefit × [(1 − (1 + monthly rate)^−n) ÷ monthly rate], with n the number of monthly payments. The left side holds the term at 20 years and moves the rate from 3% to 7%. The right side holds the rate at 5% and moves the term from 15 to 30 years.
| Rate (20 years) | Present value | Total payments | Discounting removes | Break-even years |
|---|---|---|---|---|
| 3% | $361,942.76 | $480,000.00 | $118,057.24 | 15.08 |
| 4% | $332,105.23 | $480,000.00 | $147,894.77 | 13.84 |
| 5% | $305,886.89 | $480,000.00 | $174,113.11 | 12.75 |
| 6% | $282,768.62 | $480,000.00 | $197,231.38 | 11.78 |
| 7% | $262,314.09 | $480,000.00 | $217,685.91 | 10.93 |
| Term (at 5%) | Present value | Total payments | Discounting removes | Break-even years |
|---|---|---|---|---|
| 15 years | $254,770.32 | $360,000.00 | $105,229.68 | 10.62 |
| 20 years | $305,886.89 | $480,000.00 | $174,113.11 | 12.75 |
| 25 years | $345,938.05 | $600,000.00 | $254,061.95 | 14.41 |
| 30 years | $377,319.19 | $720,000.00 | $342,680.81 | 15.72 |
Two patterns in the tables are worth reading. First, the rate moves the value more than the term does: five extra years, from 20 to 25, add $40,051.16 to the present value, while one point of rate, from 5% to 6%, takes $23,118.27 away, and four points, from 3% to 7%, take $99,628.67 away. Second, the later years add less and less: the jump from 15 to 20 years adds $51,116.57, from 20 to 25 adds $40,051.16, and from 25 to 30 adds $31,381.14, because payments thirty years out are discounted hardest. That is why the horizon matters, but the rate matters more. For a different monthly benefit, scale the figures: the present value of a $1,000 monthly pension for 20 years at 5% is half of the $2,000 figure, which is $152,943.44, and the present value of a $4,000 monthly pension is double, which is $611,773.77.
Frequently asked questions
What is a UPS retirement calculator?
It is a tool that works out what a monthly pension is worth as a single lump sum. Enter the monthly benefit, the years of payments, and a discount rate, and it gives the present value, the total of the payments, and the break-even years. This calculator is not affiliated with, endorsed by, or connected to UPS (United Parcel Service). It is a generic pension valuation tool for anyone comparing a lump sum with monthly payments, including UPS retirees.
How do I calculate the present value of a pension?
Discount every monthly payment back to today and add the results. The formula is PV = PMT × [(1 − (1 + r)^−n) ÷ r], where PMT is the monthly benefit, r is the monthly discount rate, and n is the number of monthly payments. A $2,000 monthly pension for 20 years at a 5% annual rate is worth $305,886.89. This calculator does that arithmetic for you, including the conversion of the annual rate to its monthly equivalent.
Is it better to take a pension lump sum or monthly payments?
Monthly payments usually come out ahead if they are collected past the break-even age, because they also give income that cannot be outlived. The lump sum usually fits better if health is poor, if other guaranteed income already covers the basics, or if leaving money to heirs matters. Divide the lump sum by one year of pension payments to find the break-even years: a $300,000 lump sum against $24,000 a year breaks even after 12.5 years.
How is the lump sum for a pension worked out by the plan?
For private-sector plans in the United States, Section 417(e) of the Internal Revenue Code requires the plan to use three IRS-published segment rates — for payments in years 1–5, 6–20, and beyond 20 years — and a prescribed mortality table. The IRS publishes updated segment rates each month. The rates published for January 2026 were 4.03%, 5.20%, and 6.12%. When segment rates rise, lump sums fall, and when they fall, lump sums rise.
How long will my pension payments last?
That depends on how long the retiree lives, which no calculator can know. The Social Security Administration’s 2023 period life table gives a 65-year-old man 18.12 more years on average and a 65-year-old woman 20.66 more years. Those are population averages. A person in good health with long-lived parents should plan on a longer horizon than the average, and a person in poor health on a shorter one. This tool takes the years you enter and does not guess them for you.
Does this calculator work for the Indian Unified Pension Scheme (UPS)?
No. The Indian Unified Pension Scheme is a different scheme for Indian central government employees, with an assured payout of 50% of the average basic pay of the last 12 months after 25 years of service and a minimum of ₹10,000 a month after 10 years. This page does not model that scheme, its formulas, or its service rules. It is a generic present-value tool for a monthly pension, for anyone weighing a lump sum against monthly payments.