Pull Calculator
This tool works out the chance of pulling at least one item you want. Pick a mode: draw cards from a deck without putting them back, or repeat a pull where every try has the same chance.
Probabilities assume a fair shuffle in deck mode and independent pulls at a fixed chance in repeated-pulls mode. Real games may differ: pity systems, changing rates, searching the deck and mulligans are not counted here.
A pull calculator works out the chance of getting at least one item you want from a set of draws or pulls. This one covers two cases: drawing cards from a deck without putting them back, and repeating a pull where every try has the same chance. If you are asking “what are his chances” of drawing a card he needs, the “at least one” figure this tool shows is the answer.
How do I use the Pull Calculator?
First pick a mode. “Draw from a deck” is for cards, raffle tickets, names from a hat, or any draw where each item taken out stays out. “Repeated pulls, same chance each time” is for packs, gacha pulls, loot boxes, or any try where the chance resets after every pull.
In deck mode, enter three numbers. Deck size is the total number of cards: 52 for a standard deck, 60 for a Magic: The Gathering or Pokémon TCG deck, 40 for a Yu-Gi-Oh! deck. Wanted cards is how many of the card you want are in the deck: 4 for the four aces, 13 for all the hearts, 1 for a single named card. Cards drawn is how many you take: 5 for a poker hand, 7 for an opening hand, 13 for a full bridge hand. Press Calculate and the tool shows six results: the chance of at least one wanted card, the chance of exactly one, the chance of none, the expected number of wanted cards, and how many draws it takes to reach a 50% chance and a 90% chance.
In repeated-pulls mode, enter two numbers. Chance per pull is the published rate for one try, as a percentage: 5 for a 5% chance, 0.5 for a 0.5% chance. Number of pulls is how many tries you make: 10 packs, 50 pulls, 100 pulls. Press Calculate and the tool shows the same six results: at least one success, exactly one success, none, expected successes, and pulls needed for a 50% chance and a 90% chance.
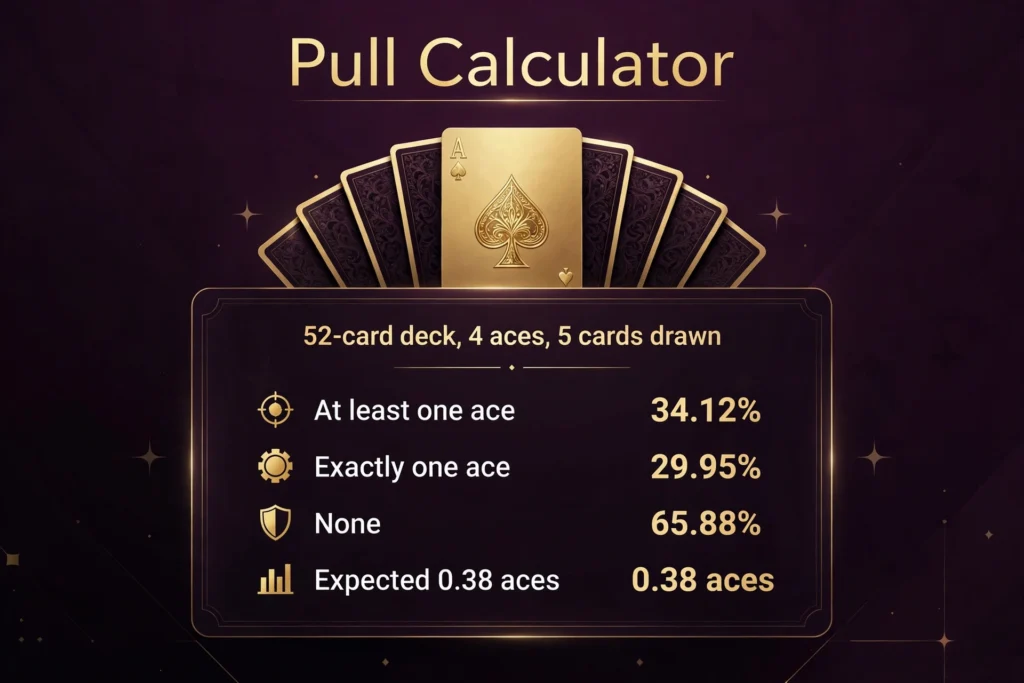
The default example is a 52-card deck with 4 aces, drawing 5 cards. The tool shows a 34.12% chance of at least one ace, a 29.95% chance of exactly one ace, a 65.88% chance of none, an expected 0.38 aces, 9 draws for a 50% chance and 23 draws for a 90% chance. The default repeated-pulls example is a 5% chance per pull over 10 pulls: a 40.13% chance of at least one success, a 31.51% chance of exactly one, a 59.87% chance of none, an expected 0.50 successes, 14 pulls for a 50% chance and 45 pulls for a 90% chance.
If an input is wrong, the tool shows a plain-language error and no results. A blank deck size is rejected with “Enter the deck size.” A deck size that is not a whole number is rejected, because half a card cannot be drawn. A deck size below 2 is rejected, and a deck size above 10,000 is rejected. A blank wanted-cards field is rejected with “Enter how many wanted cards are in the deck.” Wanted cards below 1 are rejected, and wanted cards above the deck size are rejected with “The wanted cards cannot be more than the deck size.” A blank cards-drawn field is rejected with “Enter how many cards you draw.” Drawing 0 cards is rejected, and drawing more cards than the deck holds is rejected with “You cannot draw more cards than the deck holds.” In repeated-pulls mode, a blank chance is rejected with “Enter the chance per pull, as a percentage.” A chance below 0% or above 100% is rejected. A blank pulls field is rejected with “Enter how many pulls you make.” Zero pulls are rejected, and more than 10,000 pulls are rejected. A chance of 0% is accepted: every result is 0% except the chance of none, which is 100.00%, and the pulls-for-50% and pulls-for-90% boxes read “Never”. A chance of 100% is accepted too: with 5 pulls the chance of at least one success is 100.00%, exactly one is 0.00%, none is 0.00%, and the expected number is 5.00.
What does a worked example look like?
Take the deck example and work it by hand. A standard deck has 52 cards, 4 of them aces, and you draw 5. The chance of drawing no ace at all is the number of 5-card hands with no ace, divided by the number of 5-card hands in total. Hands with no ace come from the 48 non-ace cards: C(48, 5) = 1,712,304. All possible hands come from all 52 cards: C(52, 5) = 2,598,960. So the chance of none is 1,712,304 / 2,598,960 = 0.658842, or 65.88%. The chance of at least one ace is 1 − 0.658842 = 0.341158, or 34.12%. The chance of exactly one ace is the hands with one ace and four other cards: C(4, 1) × C(48, 4) = 4 × 194,580 = 778,320, divided by 2,598,960, which is 0.299474, or 29.95%. The expected number of aces is 5 × 4 / 52 = 20 / 52 = 0.38.
A second deck example uses a 60-card deck with 4 copies of a card and a 7-card opening hand, the standard opening hand in Magic: The Gathering and the Pokémon TCG. The chance of none is C(56, 7) / C(60, 7) = 0.600500, or 60.05%. The chance of at least one copy is 1 − 0.600500 = 0.399500, or 39.95%. The chance of exactly one copy is 33.63%, and the expected number of copies is 7 × 4 / 60 = 0.47. So a player opens with the card they need about two games in five, and opens without it about three games in five.
A third deck example changes the wanted cards. A 52-card deck holds 13 hearts. Draw 5 cards. The chance of no heart is C(39, 5) / C(52, 5) = 575,757 / 2,598,960 = 0.221534, or 22.15%. The chance of at least one heart is 1 − 0.221534 = 0.778466, or 77.85%. The chance of exactly one heart is C(13, 1) × C(39, 4) / C(52, 5) = 13 × 82,251 / 2,598,960 = 0.411420, or 41.14%. The expected number of hearts is 5 × 13 / 52 = 1.25. With a quarter of the deck wanted, most 5-card hands hold at least one.
Now the repeated-pulls example, worked by hand. The chance per pull is 5%, and you make 10 pulls. The chance of no success in all 10 pulls is 0.95^10 = 0.598737, or 59.87%. The chance of at least one success is 1 − 0.598737 = 0.401263, or 40.13%. The chance of exactly one success is 10 × 0.05 × 0.95^9 = 0.5 × 0.630249 = 0.315125, or 31.51%. The expected number of successes is 10 × 0.05 = 0.50.
A second repeated-pulls example uses a 1% chance per pull over 100 pulls. The chance of none is 0.99^100 = 0.366032, or 36.60%. The chance of at least one success is 1 − 0.366032 = 0.633968, or 63.40%. The chance of exactly one success is 100 × 0.01 × 0.99^99 = 0.369730, or 36.97%. The expected number of successes is 100 × 0.01 = 1.00. A hundred pulls at 1% still leaves a 36.60% chance of nothing, which is why a low rate feels harsh even after many tries.
A third repeated-pulls example uses a 0.5% chance per pull over 50 pulls. The chance of none is 0.995^50 = 0.778313, or 77.83%. The chance of at least one success is 1 − 0.778313 = 0.221687, or 22.17%. The chance of exactly one success is 50 × 0.005 × 0.995^49 = 0.25 × 0.782224 = 0.195556, or 19.56%. The expected number of successes is 50 × 0.005 = 0.25. Fifty pulls at half a percent still fail more than three times in four.
What is the hypergeometric distribution?
The hypergeometric distribution is the mathematics of drawing without replacement. It answers one question: if a fixed-size deck holds a fixed number of wanted cards, and you draw a fixed number of cards without putting any back, what is the chance of getting exactly k wanted cards? The formula is P(X = k) = C(K, k) × C(D − K, N − k) / C(D, N), where D is the deck size, K is the number of wanted cards, N is the number of cards drawn, and k is the number of wanted cards in the draw. C(a, b) counts the ways to choose b items from a, so C(K, k) counts the ways to pick the wanted cards, C(D − K, N − k) counts the ways to fill the rest of the hand from the unwanted cards, and C(D, N) counts all possible hands.
The key idea is that every draw changes the odds for the next one. Draw one card from a 52-card deck with 4 aces and the chance the first card is an ace is 4/52, or 7.69%. If that card is an ace, the chance the next card is an ace falls to 3/51. If it is not an ace, the chance rises to 4/51. The deck remembers what left it. That is why the formula divides by C(D, N): every hand of N cards is equally likely, and the count of hands with k wanted cards is the product of the two choices above. The standard reference for the distribution is the hypergeometric distribution.
The expected number of wanted cards is N × K / D: the draws multiplied by the share of wanted cards in the deck. For 5 cards from a 52-card deck with 4 aces, that is 5 × 4 / 52 = 0.38. For 13 cards from the same deck, it is 13 × 4 / 52 = 1.00. The probabilities for every possible k — from 0 up to the smaller of K and N — add up to exactly 1, because every hand holds some number of wanted cards and the cases cover all of them. For the 5-card ace example the five probabilities (k = 0 to 4) sum to 1.000000000000, and for the 60-card opening-hand example the eight probabilities (k = 0 to 4, with the rest zero) sum to 1.000000000000 as well.
What is the binomial distribution?
The binomial distribution is the mathematics of repeated tries at a fixed chance. It answers one question: if each try has the same chance p of success, and you make N independent tries, what is the chance of exactly k successes? The formula is P(X = k) = C(N, k) × p^k × (1 − p)^(N − k). C(N, k) counts the ways the k successes can be spread across the N tries, p^k is the chance of those k successes, and (1 − p)^(N − k) is the chance of the remaining failures. The standard reference for the distribution is the binomial distribution.
The “at least one” figure comes from the complement: the chance of at least one success is 1 minus the chance of no success at all, and the chance of no success is (1 − p)^N, because every single try has to fail. For 10 pulls at 5%, that is 1 − 0.95^10 = 1 − 0.598737 = 0.401263, or 40.13%. For 100 pulls at 1%, it is 1 − 0.99^100 = 1 − 0.366032 = 0.633968, or 63.40%. The expected number of successes is N × p: 10 pulls at 5% give 0.50 expected successes, and 100 pulls at 1% give 1.00.
The number of pulls needed for a target chance comes from the same line of arithmetic, solved for N: pulls = ln(1 − q) / ln(1 − p), rounded up, where q is the target chance. For a 50% chance at 5% per pull, that is ln(0.5) / ln(0.95) = 13.51, rounded up to 14 pulls. For a 90% chance at 5%, it is ln(0.1) / ln(0.95) = 44.89, rounded up to 45 pulls. For a 50% chance at 1%, it is ln(0.5) / ln(0.99) = 68.97, rounded up to 69 pulls; for 90% at 1%, it is ln(0.1) / ln(0.99) = 229.11, rounded up to 230 pulls. The tool runs this calculation for both the 50% and 90% targets.
Which mode should I use — deck or repeated pulls?
Use deck mode when each draw removes an item and the odds change as the draw goes on. Card games are the clearest case: poker, bridge, Magic: The Gathering, Pokémon TCG, Yu-Gi-Oh! — every card drawn is a card that cannot be drawn again. Raffles work the same way: once a ticket is drawn, it is out. Drawing names from a hat, dealing a hand, or pulling parts from a fixed lot all belong in deck mode. The giveaway is a fixed total: there is a deck of a known size, and the wanted items are a known count inside it.
Use repeated-pulls mode when every try starts fresh with the same chance. Opening sealed packs is the usual case: each pack is printed independently, so the tenth pack has the same rate as the first. Gacha pulls at a published fixed rate, loot boxes, coin flips, and dice rolls all belong here. The giveaway is independence: what happened on the last try says nothing about the next one.
Two cases need care. Some games mix the two: a deck that is shuffled back in after every draw behaves like repeated pulls, not like a deck, because the drawn card returns. And many gacha games do not use a fixed rate at all: pity systems raise the rate after a run of failures, and some boxes guarantee a hit after a set number of pulls. This tool does not model pity, changing rates, deck searching, or mulligans. Its figures assume a fair shuffle in deck mode and independent pulls at a fixed chance in repeated-pulls mode. If a game changes its own rate as you play, the figures here describe the fixed-rate case only. This page gives no gambling advice and no encouragement to spend money on pulls; it only works out the arithmetic of a stated chance.
What does the expected number mean?
The expected number is the average over many repeats, not a promise about one try. An expected 0.38 aces in a 5-card draw means that if you dealt thousands of 5-card hands, the average number of aces per hand would settle near 0.38. It does not mean any single hand holds 0.38 of an ace, and it does not mean you will see an ace in roughly two hands out of five — the chance of at least one ace is 34.12%, which is a different number from 0.38, and the two should not be confused.
The gap between the expected number and the “at least one” chance is widest when the expected number is small. With 13 draws from a 52-card deck, the expected number of aces is exactly 1.00, yet the chance of drawing no ace at all is still 30.38%. An average of one ace per hand and a three-in-ten chance of zero aces live side by side, because some hands hold two or three aces and balance the empty ones. The same pattern shows in repeated pulls: 100 pulls at 1% have an expected 1.00 successes, yet the chance of none is 36.60%.
When the expected number is large, the two figures converge in feel: 20 pulls at 10% have an expected 2.00 successes and an 87.84% chance of at least one. When the expected number is small, the “at least one” chance is always below it as a proportion: 50 pulls at 0.5% have an expected 0.25 successes and a 22.17% chance of at least one. The mean median mode calculator on this site works out averages for a set of numbers, which is the same idea applied to data you already hold rather than to a draw you are about to make.
How many draws or pulls do I need for a 50% or 90% chance?
The tool answers this directly in its last two boxes, and the pattern is worth seeing whole. For aces in a 52-card deck, 9 draws reach a 50% chance of at least one ace and 23 draws reach a 90% chance. That is the whole story of the ace table below: the 50% line is crossed between 8 draws (49.86%) and 9 draws (54.41%), and the 90% line is not crossed until 23 draws, because each extra card adds less than the one before it.
For repeated pulls, the numbers grow as the rate shrinks. At 10% per pull, 7 pulls reach a 50% chance and 22 pulls reach a 90% chance. At 5%, it is 14 pulls for 50% and 45 for 90%. At 1%, it is 69 pulls for 50% and 230 for 90%. At 0.5%, it is 139 pulls for 50% and 460 for 90%. The 90% target always costs about 3.3 times as many pulls as the 50% target, because ln(0.1) / ln(0.5) is 3.32 — a fixed ratio that holds at every rate. Doubling the pulls never doubles the chance: 10 pulls at 5% give 40.13%, and 20 pulls give 64.15%, not 80.26%. The chance approaches 100% but never reaches it, because (1 − p)^N is never quite zero.
What are the odds of drawing an ace?
Every figure in this table was computed with the same formula the tool uses, for drawing N cards from a standard 52-card deck holding 4 aces. The “at least one” column is the headline figure; the “exactly one” column shows how the chance of seeing precisely one ace rises and then falls as more cards are drawn; the “none” column is the complement; and the “expected” column is N × 4 / 52.
| Cards drawn | At least one ace | Exactly one ace | No ace | Expected aces |
|---|---|---|---|---|
| 1 | 7.69% | 7.69% | 92.31% | 0.08 |
| 2 | 14.93% | 14.48% | 85.07% | 0.15 |
| 3 | 21.74% | 20.42% | 78.26% | 0.23 |
| 4 | 28.13% | 25.56% | 71.87% | 0.31 |
| 5 | 34.12% | 29.95% | 65.88% | 0.38 |
| 6 | 39.72% | 33.64% | 60.28% | 0.46 |
| 7 | 44.96% | 36.69% | 55.04% | 0.54 |
| 8 | 49.86% | 39.14% | 50.14% | 0.62 |
| 9 | 54.41% | 41.03% | 45.59% | 0.69 |
| 10 | 58.66% | 42.40% | 41.34% | 0.77 |
| 11 | 62.59% | 43.31% | 37.41% | 0.85 |
| 12 | 66.24% | 43.79% | 33.76% | 0.92 |
| 13 | 69.62% | 43.88% | 30.38% | 1.00 |
Three patterns in the table are worth reading. First, the “at least one” column climbs steeply at first and then flattens: the first card adds 7.69 points, the thirteenth adds only 3.38. Second, the “exactly one” column peaks late: it keeps rising all the way to 13 draws, because with more cards drawn, hands with exactly one ace keep getting more likely even as hands with two or more aces grow faster. Third, the “expected” column grows in a straight line — 0.08, 0.15, 0.23, 0.31 — adding 4/52, or 0.08, with every card, while the “at least one” column bends. That bend is the signature of drawing without replacement: each card drawn leaves fewer aces and fewer cards behind it.
What mistakes do people make with pull odds?
The most common mistake is adding percentages. One card from a 52-card deck has a 7.69% chance of being an ace, so five cards must be 5 × 7.69% = 38.45% — or so the reasoning goes. It is wrong, and the correct figure is 34.12%. Adding counts the hands with two aces twice, the hands with three aces three times, and so on. The right way is the complement: work out the chance of no ace (65.88%) and subtract from 100%. The same error appears in repeated pulls: 10 pulls at 5% is not 50%, it is 40.13%, for the same reason — the pulls with two successes get counted twice.
The second mistake is using the wrong mode. Treating a deck draw as repeated pulls gives a wrong answer in the other direction: the binomial shortcut 1 − (48/52)^5 gives 32.98%, against the correct 34.12%. It is too low because it pretends each card is put back and the deck stays at 52 cards, when in fact every non-ace drawn raises the chance the next card is an ace. The gap is small for one draw and grows with the number drawn, so the mode matters most exactly where the stakes are highest. The 6 sided dice roller on this site is a repeated-pulls case in miniature: each roll is independent, so the chance of at least one six in 5 rolls is 1 − (5/6)^5 = 59.81%, and no roll changes the next one.
The third mistake is the gambler’s fallacy: the belief that a run of failures makes a success due. In repeated-pulls mode it does not. After 9 pulls with no success at 5% per pull, the tenth pull still has a 5% chance. The pulls have no memory. In deck mode the opposite is true and the fallacy runs the other way: after drawing 9 cards with no ace, the chance the next card is an ace has risen, from 4/52 to 4/43, or 9.30%, because the deck really has changed. Knowing which case you are in is the whole skill.
The fourth mistake is reading the expected number as a guarantee. An expected 1.00 aces in 13 cards does not mean one ace is assured; 30.38% of 13-card hands hold none. An expected 1.00 successes in 100 pulls at 1% does not mean one success is assured; 36.60% of those runs hold none. Averages describe many repeats, not one try.
The fifth mistake is rounding too early. The difference between 34.12% and 34% looks trivial, but over a long run of games it is a real gap: 34.12% of a thousand hands is 341 hands, and 34% is 340. The tool shows two decimal places for every percentage so the figures stay exact enough to compare, and the percentage calculator on this site works out the same kind of percentage arithmetic for any other numbers you need to compare.
How can I check the tool against a known result?
The simplest check uses the default deck example. Enter a deck size of 52, 4 wanted cards, and 5 cards drawn, and press Calculate. The tool should show 34.12% for at least one wanted card, 29.95% for exactly one, 65.88% for none, 0.38 expected, 9 draws for a 50% chance and 23 draws for a 90% chance. The note should read “Deck: chance of none = C(48, 5) / C(52, 5) = 65.88%; chance of at least one = 1 – that = 34.12%.”
A second check uses a 60-card deck with 4 copies and a 7-card hand. The tool should show 39.95% for at least one, 33.63% for exactly one, 60.05% for none, 0.47 expected, 10 draws for a 50% chance and 26 draws for a 90% chance. This matches the worked opening-hand example published by Z Table for the same deck, hand and copy count.
A third check uses 13 wanted cards and 5 drawn from a 52-card deck. The tool should show 77.85% for at least one, 41.14% for exactly one, 22.15% for none, 1.25 expected, 3 draws for a 50% chance and 8 draws for a 90% chance.
A fourth check uses a single card drawn from a 52-card deck with 4 aces. The tool should show 7.69% for at least one, 7.69% for exactly one, 92.31% for none, and 0.08 expected. One card in thirteen is an ace, so 4/52 = 1/13 = 7.69% is the figure to expect.
A fifth check uses repeated pulls at 5% over 10 pulls. Switch the mode, enter 5% and 10 pulls, and press Calculate. The tool should show 40.13% for at least one success, 31.51% for exactly one, 59.87% for none, 0.50 expected, 14 pulls for a 50% chance and 45 pulls for a 90% chance. The note should read “Repeated pulls: chance of none = (1 – 0.05)^10 = 59.87%; chance of at least one = 1 – that = 40.13%.”
A sixth check uses 1% over 100 pulls. The tool should show 63.40% for at least one, 36.97% for exactly one, 36.60% for none, 1.00 expected, 69 pulls for a 50% chance and 230 pulls for a 90% chance.
A seventh check uses 0.5% over 50 pulls. The tool should show 22.17% for at least one, 19.56% for exactly one, 77.83% for none, 0.25 expected, 139 pulls for a 50% chance and 460 pulls for a 90% chance.
An eighth check tests the edges. Enter a chance of 0% with 10 pulls: the tool should show 0.00% for at least one, 0.00% for exactly one, 100.00% for none, 0.00 expected, and “Never” for both the 50% and 90% boxes. Enter a chance of 100% with 5 pulls: the tool should show 100.00% for at least one, 0.00% for exactly one, 0.00% for none, 5.00 expected, and “1 pull” for both targets. Enter 52 cards drawn from a 52-card deck with 4 aces: the tool should show 100.00% for at least one, 0.00% for exactly one, 0.00% for none, and 4.00 expected, because the whole deck holds all four aces.
A ninth check tests the errors. Enter 6 cards drawn from a 52-card deck with 60 wanted cards and the tool should show the error “The wanted cards cannot be more than the deck size.” with no results. Enter 53 cards drawn from a 52-card deck and the tool should show the error “You cannot draw more cards than the deck holds.” with no results. Enter 0 cards drawn and the tool should show the error “You must draw at least 1 card.” with no results. Enter a chance of 101% and the tool should show the error “The chance per pull cannot be above 100%.” with no results. Enter a chance of −5% and the tool should show the error “The chance per pull cannot be below 0%.” with no results.
The random number generator on this site picks numbers with equal chance, which is the same fair-and-independent idea the repeated-pulls mode assumes. The ratio multipliers on this site scale ratios up and down, which is the same scaling the expected-number figures use when the deck size or pull count changes. More tools in the same collection are in the calculators category.
Frequently asked questions
What is a pull calculator?
A pull calculator works out the chance of getting at least one item you want from a set of draws or pulls. This one covers two cases: drawing cards from a deck without putting them back, and repeating a pull where every try has the same chance. You enter the deck size, the wanted cards and the cards drawn, or the chance per pull and the number of pulls, and it shows the chance of at least one, exactly one and none, plus the expected number and the draws or pulls needed for a 50% and a 90% chance.
What is the chance of drawing an ace from a 52-card deck?
It depends on how many cards you draw. One card gives a 7.69% chance, because 4 of 52 cards are aces. Five cards give a 34.12% chance of at least one ace. Seven cards give 44.96%. Thirteen cards give 69.62%. The full table for 1 to 13 cards is in the article above, with every figure computed from the hypergeometric formula.
How do you calculate the probability of drawing a card?
Use the hypergeometric formula: P(X = k) = C(K, k) × C(D − K, N − k) / C(D, N), where D is the deck size, K is the number of wanted cards, N is the cards drawn and k is the wanted cards in the draw. For the chance of at least one wanted card, work out the chance of none and subtract from 1. For 4 aces in 5 cards from a 52-card deck, the chance of none is C(48, 5) / C(52, 5) = 1,712,304 / 2,598,960 = 65.88%, so the chance of at least one ace is 34.12%.
What is the difference between drawing from a deck and repeated pulls?
Drawing from a deck removes each card, so the odds change after every draw: that is the hypergeometric case. Repeated pulls start fresh every time, so the chance stays the same: that is the binomial case. Use deck mode for card games, raffles and hands; use repeated-pulls mode for packs, gacha pulls, coin flips and dice rolls. Using the wrong mode gives a wrong answer — treating 5 cards from a 52-card deck as repeated pulls gives 32.98% instead of the correct 34.12%.
How many pulls do I need for a 90% chance?
It depends on the chance per pull: divide ln(0.1) by ln(1 − p) and round up, where p is the chance per pull as a decimal. At 10% per pull it is 22 pulls; at 5% it is 45 pulls; at 1% it is 230 pulls; at 0.5% it is 460 pulls. The 90% target always costs about 3.3 times as many pulls as the 50% target. The tool shows both targets for any rate you enter.
Does the chance go up after failed pulls?
In repeated-pulls mode, no. Every pull has the same chance, and a run of failures changes nothing about the next pull — that is the gambler’s fallacy. In deck mode, yes, in a limited sense: after drawing cards with no ace, the chance the next card is an ace has risen, because the deck now holds the same 4 aces among fewer cards. After 9 cards with no ace from a 52-card deck, the chance the tenth card is an ace is 4/43, or 9.30%, against 7.69% at the start.