Retirement Income Calculator
Retirement Income Calculator
Add your Social Security, pension and portfolio withdrawals into one monthly total, then check it against the spending you plan for.
A retirement income calculator with Social Security adds up everything you expect to receive each month in retirement — your Social Security benefit, any pension, what your savings can pay, and any other income — and shows whether that total covers the spending you plan for. Enter the figures from your own statements and the calculator gives you one monthly total, one annual total, and the gap between your income and your target.
What counts as retirement income?
Retirement income is every regular payment you expect to receive after you stop working. For most people it comes from four places. Social Security is the monthly benefit paid by the Social Security Administration, based on your earnings record and the age you start claiming. A pension is a monthly payment from a former employer, usually from a defined-benefit plan that pays for life. Portfolio income is what your savings — a 401(k), IRA, or taxable investment account — can pay you each month, usually worked out as a percentage of the balance each year. Other income covers anything else that arrives regularly: rental income, an annuity, part-time work, or a spouse's benefit.
The order matters. Social Security and a pension are guaranteed income: they arrive every month for life and do not depend on the stock market. Portfolio income is the flexible part — you can change the amount, but the balance can also fall. Knowing how much of your total is guaranteed and how much comes from savings is the first step in judging whether your plan holds up. In the worked example below, guaranteed income is 65.2% of the total, which means most of the monthly total does not depend on market returns.
One thing this page does not do is estimate your Social Security benefit. That figure depends on your full 35-year earnings record, and the only place to get it right is your own Social Security Statement. The calculator takes the benefit as an input, which is also how the strongest pages on this topic work: they ask for the monthly amount from your statement in today's dollars.
Where do I find my Social Security benefit amount?
Your Social Security benefit amount is on your Social Security Statement. The easiest way to see it is to sign in to your my Social Security account at ssa.gov, where the statement shows your estimated benefit at age 62, at your full retirement age, and at age 70. If you do not have an online account, you can create one there, or request a paper statement. The statement is free, and it is the only figure worth planning around — a benefit guessed from an average will not match your earnings record.
Use the figure for the age you actually plan to claim. If the statement says $2,000 a month at full retirement age and you plan to claim at 62, that $2,000 is not your number — the amount will be lower, as the next section explains. Pick the figure that matches your claiming plan, in today's dollars, and enter it in the calculator.
Two things this calculator does not do, and they are worth saying directly. It does not estimate a Social Security benefit from your earnings, and it does not calculate Social Security back pay or disability back pay. Back pay — the lump sum owed when benefits are approved after a delay — is a separate subject with its own rules and timing, and it is not part of a monthly retirement income total. If you came here looking for a back-pay calculation, the SSA is the place to ask, and this page will not give you a number for it.
How does the age I claim Social Security change my benefit?
The age you start claiming Social Security changes your monthly benefit for the rest of your life. You can start as early as age 62, but the Social Security Administration reduces the benefit for every month you claim before your full retirement age. If you wait past full retirement age, the benefit grows through delayed retirement credits, up to age 70. There is no further increase after 70, even if you keep waiting.
For people born in 1960 or later, full retirement age is 67. Claiming at 62 gives 70% of the full benefit. Claiming at 67 gives 100%. Claiming at 70 gives 124%. The reduction works out at 5/9 of 1% per month for the first 36 months before full retirement age, then 5/12 of 1% per month after that. Delayed retirement credits add 2/3 of 1% per month — 8% a year — after full retirement age up to 70. These figures come from the Social Security Administration's own tables.
That spread is large enough to change a retirement plan. Take a full benefit of $2,000 a month. Claiming at 62 would pay about $1,400 a month; claiming at 70 would pay about $2,480 a month. Over a 20-year retirement, the difference between those two monthly figures is close to $260,000 before cost-of-living adjustments. Claiming early also means more years of payments, so the right choice depends on health, other income, and how long you expect to live — but the monthly figure itself is fixed by the claiming age, and it is permanent.
A related point: if you claim before full retirement age and keep working, the SSA withholds part of your benefit while your earnings are above a limit. After full retirement age, the earnings test no longer applies and you can earn as much as you want without a reduction. Your benefit is also recalculated later to credit months when benefits were withheld.
What is the 4% rule and where did it come from?
The 4% rule is a starting point for how much a portfolio can pay each year in retirement. It says you can withdraw 4% of your starting balance in the first year, then adjust that amount for inflation each year after, and the money should last at least 30 years. On a $500,000 portfolio, that is $20,000 a year, or $1,666.67 a month — the same figure this calculator uses in its worked example.
The rule comes from two pieces of research. Financial planner William Bengen published the original finding in 1994 in the Journal of Financial Planning, in a paper called "Determining Withdrawal Rates Using Historical Data". He tested every 30-year retirement starting year from 1926 onward, using actual US stock and bond returns, and found that a 4% first-year withdrawal survived every historical 30-year window without running out of money. Four years later, the Trinity study — by Philip Cooley, Carl Hubbard and Daniel Walz at Trinity University — tested withdrawal rates from 3% to 12% over 15-to-30-year periods and reported success rates. At 4% with a 75% stock and 25% bond mix over 30 years, about 98% of historical periods succeeded.
The rule has limits, and both studies were clear about them. It was built on US market history, a 30-year horizon, and a fixed withdrawal that rises with inflation every year without exception. It assumed no other income — no Social Security, no pension, no part-time work. A retirement longer than 30 years, a bad run of returns early on, or fees and taxes can all change the outcome. Some researchers now use 3.5% or 3.9% as a more cautious starting point for the same 30-year horizon. This calculator lets you enter any rate, so you can see what 3%, 4% or 5% each pay on your own balance — the quick-reference table below shows the difference on balances from $250,000 to $1,000,000.
How much monthly income do I need in retirement?
The usual rule of thumb is 70–80% of your pre-retirement income. If you earned $7,500 a month before retiring, that points to $5,250–$6,000 a month in retirement. The logic is that some costs disappear when work stops: commuting, payroll taxes, and retirement saving itself. Higher earners may need a smaller share, because so much of their income was being saved, while renters or people with high health costs may need more.
A better starting point is your actual spending. Add up what you expect to spend each month in retirement — housing, food, transport, insurance, health care, travel, and everything else — and use that as your target. Spending, not income, is what retirement has to pay for, and a spending-based target catches costs the 70–80% rule misses. The calculator asks for a target monthly spending figure for exactly this reason: the gap it shows is the gap between your income and your own spending, not a generic percentage.
Health care deserves its own line in that budget. It is the one cost that tends to rise faster than general inflation, and it is also the hardest to predict. Medicare covers much of it, but premiums, deductibles, and costs Medicare does not cover still come out of the monthly total. If your target spending figure does not include a health-care allowance, the gap the calculator shows will be smaller than the real one.
How do pensions fit into retirement income?
A pension is a monthly payment from a former employer, usually for life. Most pensions that still exist are defined-benefit plans, where the amount is set by a formula rather than by an account balance: typically your final average salary, multiplied by your years of service, multiplied by the plan's percentage factor. A plan with a 2% factor, 30 years of service, and an $80,000 final average salary would pay $48,000 a year, or $4,000 a month, before tax. Your own figure is on your plan's benefit statement — use that number, not a formula estimate, when you enter it in the calculator.
Pensions differ from Social Security in two ways worth knowing. First, many pensions do not rise with inflation. A $1,500 monthly pension that never increases buys less every year, while Social Security gets a cost-of-living adjustment most years. Over a 25-year retirement, that difference is large. Second, a pension may offer a choice at retirement: a higher monthly payment for your life only, or a lower payment that continues to your spouse after you die. That choice changes the monthly figure, so enter the amount that matches the option you chose or plan to choose.
If you have a choice between a pension and a lump sum, the two are not directly comparable on this page — a lump sum is a balance, and this calculator treats balances through the withdrawal rate. The UPS Retirement Calculator on this site compares a lump sum with a pension payment in present-value terms, which is the right way to weigh that choice.
What about taxes on retirement income?
The total this calculator shows is before tax, and tax takes a different bite from each income source. Up to 85% of Social Security benefits can be federally taxable, depending on your combined income — the figure the IRS uses, which adds your adjusted gross income, non-taxable interest, and half your Social Security benefits. At lower incomes, none of the benefit is taxable. Pension income and withdrawals from a traditional 401(k) or IRA are usually fully taxable as ordinary income. Qualified Roth IRA withdrawals are tax-free.
That mix matters when you compare two retirees with the same gross income. Someone whose income is mostly Social Security and Roth withdrawals keeps more of it than someone whose income is mostly a pension and traditional IRA withdrawals, even if both totals look the same on paper. This calculator keeps the total before tax so the figures stay simple and comparable — but when you judge whether the total covers your spending, remember that the spendable amount is smaller, and how much smaller depends on your mix of sources. The IRA Calculator on this site shows the after-tax difference between Traditional and Roth accounts for the same reason.
State tax adds another layer. Some states tax retirement income and some do not, and the rules differ by source — a state may exempt Social Security while taxing a pension, for example. Check your own state's rules separately, since this page uses no state tax figure.
How do I use this retirement income calculator?
Enter your monthly Social Security benefit first — the figure from your Social Security Statement for the age you plan to claim. Then enter your monthly pension, or zero if you have none. Enter your total portfolio and savings balance, and the withdrawal rate you want to test: 4% is the usual starting point, from the research described above, but try 3% and 5% too and watch the monthly total move. Enter any other regular monthly income, such as rent or an annuity. Finally, enter your target monthly spending — the figure from your own budget, not a rule of thumb.
The calculator adds the four income sources into one monthly total and multiplies it by 12 for the annual figure. It then compares the total with your target and shows the gap: a shortfall if your income is below the target, a surplus if it is above. The breakdown table shows each source separately, so you can see how much of the total is guaranteed income and how much comes from your portfolio. If there is a shortfall and your withdrawal rate is above zero, the verdict line also shows roughly how much more portfolio balance would close the gap at that rate.
Try changing one input at a time. Raising the withdrawal rate from 4% to 5% on a $500,000 portfolio adds $416.67 a month, but it also spends the balance faster. Delaying Social Security from 62 to 70 raises the benefit by about 77% for someone with a full retirement age of 67 — a bigger change than any withdrawal-rate tweak. The calculator is a way to test those trade-offs with your own numbers before you commit to any of them.
What does the calculator show for a typical retiree?
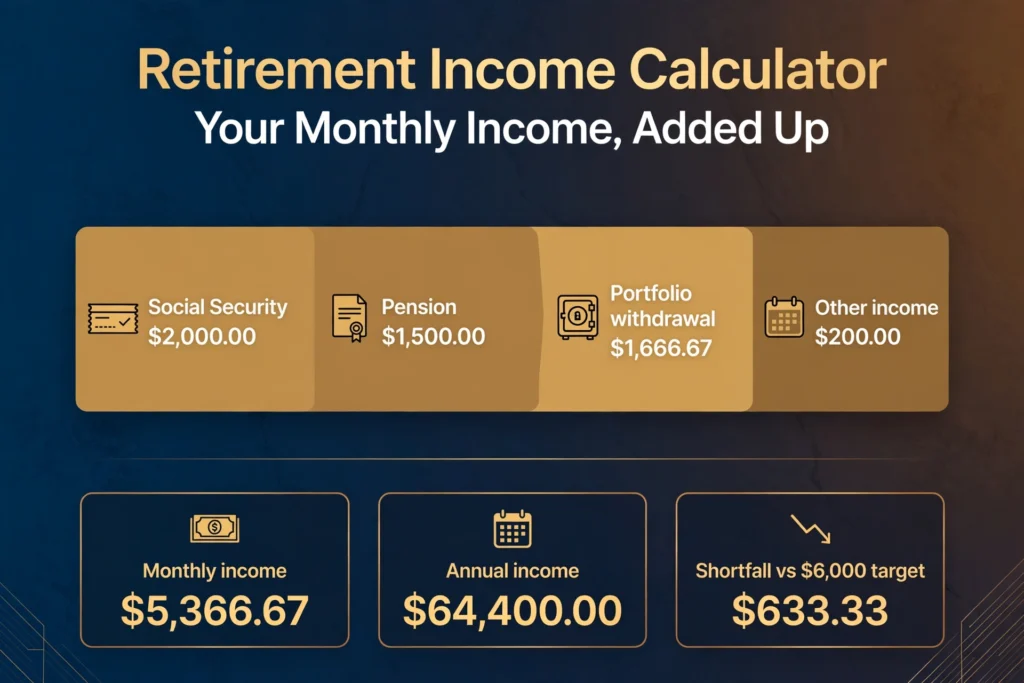
Take a retiree with a $2,000 monthly Social Security benefit, a $1,500 monthly pension, a $500,000 portfolio, $200 of other monthly income, and a target of $6,000 a month in spending. The portfolio at a 4% withdrawal rate pays $1,666.67 a month ($500,000 × 4% ÷ 12). Adding the four sources gives a total monthly income of $5,366.67, or $64,400.00 a year.
Against the $6,000 target, that leaves a shortfall of $633.33 a month, or $7,600.00 a year. Guaranteed income — Social Security plus pension — is $3,500.00, or 65.2% of the total, so most of the monthly income arrives whether markets rise or fall. Closing the $633.33 monthly gap at a 4% withdrawal rate would need about $190,000.00 more in the portfolio.
Change the numbers and the picture changes fast. With a $2,800 Social Security benefit, a $2,000 pension, an $800,000 portfolio at a lower 3.5% rate, and $300 of other income, the portfolio pays $2,333.33 a month and the total reaches $7,433.33 a month — $89,200.00 a year — beating a $6,500 target by $933.33 a month. And with no pension at all, a $1,800 benefit and a $300,000 portfolio at 5% gives $3,050.00 a month against a $4,000 target: a $950.00 monthly shortfall, or $11,400.00 a year, needing about $228,000.00 more in savings to close at 5%.
The lesson in all three cases is the same: the gap is a number you can work with. It tells you how much more income, savings, or spending change is needed, in dollars per month, instead of leaving you with a vague sense of being on track or behind.
How much monthly income does a portfolio pay?
The table below shows the monthly income a portfolio balance pays at three withdrawal rates. All figures come from the same formula this calculator uses: balance × rate ÷ 12.
| Portfolio balance | 3% a year | 4% a year | 5% a year |
|---|---|---|---|
| $250,000 | $625.00 | $833.33 | $1,041.67 |
| $500,000 | $1,250.00 | $1,666.67 | $2,083.33 |
| $750,000 | $1,875.00 | $2,500.00 | $3,125.00 |
| $1,000,000 | $2,500.00 | $3,333.33 | $4,166.67 |
A $1,000,000 portfolio at 4% pays $3,333.33 a month — the same as a $500,000 portfolio at 5% pays less than that, at $2,083.33. The balance matters more than the rate, and the rate matters more than most people expect: on $500,000, the difference between 3% and 5% is $833.33 a month. Read the table with the 4% rule's limits in mind — the higher rate pays more now, but it also draws the balance down faster, and the research behind the rule only supports the lower rates over a 30-year horizon.
What if my income falls short of my target?
A shortfall has only a few possible fixes, and each one is worth pricing with the calculator. Saving more before retirement is the most direct: the worked example shows that a $633.33 monthly gap at 4% needs about $190,000.00 more in savings, which is a large sum — and that is exactly why the gap is useful to know early, while there is still time to save. Working longer helps twice over: it adds years of saving and, if it delays claiming Social Security, it raises the monthly benefit as well.
Spending less is the other side of the same number. A $633.33 gap closed by spending means finding $633.33 a month in the budget — often easier than finding $190,000.00 in savings. Housing is usually the largest single lever: a paid-off home, a smaller home, or a move to a lower-cost area can change the target by more than any investment choice. Part-time work in the early years of retirement is a third option, and it shows up in the calculator as other monthly income.
None of these is a recommendation — they are the arithmetic options the gap leaves open, and which one fits depends on health, family, and circumstances this page cannot see. What the calculator does is put a dollar figure on the choice, so the decision is about a known amount rather than a guess.
What mistakes do people make when adding up retirement income?
The most common mistake is using the wrong Social Security figure. People take the number from their statement at full retirement age and plan as if they will claim at 62, or they use an average benefit they read online instead of their own figure. The benefit changes by hundreds of dollars a month with the claiming age, so the figure has to match the plan.
The second mistake is treating the gross total as spendable money. The calculator's total is before tax, and the tax bite differs by source — up to 85% of Social Security can be taxable, pensions and traditional account withdrawals are usually fully taxable, and Roth withdrawals are not taxed at all. A $5,366.67 gross total is not $5,366.67 to spend.
The third mistake is assuming a pension keeps its value. Social Security rises with inflation most years; many pensions do not. A pension that looks generous at 65 buys noticeably less at 85. When you compare sources, remember which ones adjust and which ones do not.
The fourth mistake is treating the 4% rule as a promise. It is a historical finding for a 30-year horizon with a specific mix of stocks and bonds, not a guarantee that any portfolio at 4% lasts 30 years. A bad run of returns in the first years of retirement — when withdrawals are coming out of a falling balance — can shorten a portfolio's life more than any later downturn. That is why the calculator lets you test 3% as well as 5%.
The fifth mistake is leaving out a cost. The target spending figure is only as good as the budget behind it. Health care, home repairs, and help for family members are the costs most often missing from a first retirement budget, and each one lands on the monthly total sooner or later. Build the target from real spending, check it against a year of actual outgoings, and revisit it when circumstances change.
This page gives general information about retirement income and how the numbers work. It is not financial advice, tax advice, or a benefits determination, and it does not take your full situation into account. The result is an estimate based on the figures you enter. For a decision about when to claim Social Security or how to withdraw from your savings, check your own statements and consider speaking to a qualified financial professional.
How much retirement income will I have each month?
Add your monthly Social Security benefit, pension, portfolio withdrawals and any other income together. As an example, a $2,000 Social Security benefit plus a $1,500 pension, a $500,000 portfolio at 4% ($1,666.67 a month) and $200 of other income gives $5,366.67 a month, or $64,400.00 a year. Enter your own figures in the calculator above for a total based on your situation.
Where do I get my Social Security benefit amount?
From your Social Security Statement, through your my Social Security account at ssa.gov. The statement shows your estimated benefit at age 62, at your full retirement age, and at age 70. Use the figure for the age you actually plan to claim, in today's dollars.
Does this calculator estimate my Social Security benefit or back pay?
No. The benefit is an input you take from your Social Security Statement — this tool does not estimate it from your earnings, and it does not calculate Social Security back pay or disability back pay. Back pay is a separate subject with its own rules, and the SSA is the place to ask about it.
Is 4% a safe withdrawal rate?
The 4% figure comes from William Bengen's 1994 research and the Trinity study of 1998, which found that withdrawing 4% of a starting balance in the first year, then adjusting for inflation, survived every historical 30-year period tested. It is a historical finding for a 30-year horizon, not a guarantee — a longer retirement, a bad run of early returns, fees or taxes can change the outcome, and some researchers now use 3.5% or 3.9% as a more cautious starting point.
How much income do I need in retirement?
The usual rule of thumb is 70–80% of pre-retirement income, because some costs fall away when work stops. A better target comes from your own spending: add up what you expect to spend each month in retirement — housing, food, transport, insurance, health care and travel — and use that figure as your target in the calculator.
Are Social Security benefits taxed?
Up to 85% of Social Security benefits can be federally taxable, depending on your combined income. At lower incomes, none of the benefit is taxable. Pension income and withdrawals from a traditional 401(k) or IRA are usually fully taxable as ordinary income, while qualified Roth withdrawals are tax-free.