
Investment Property Calculator
Enter the price, your down payment, the rent and other income, the mortgage terms, and the monthly running costs. The tool works out the mortgage payment, the monthly cash flow, and the return metrics for the property.
Total monthly income is rent plus other income minus the vacancy allowance. Total monthly expenses are the operating expenses plus the mortgage payment. Cash-on-cash return uses the down payment only as the cash invested; closing costs are not included. This tool gives an informational estimate from the figures entered. It is not financial advice.
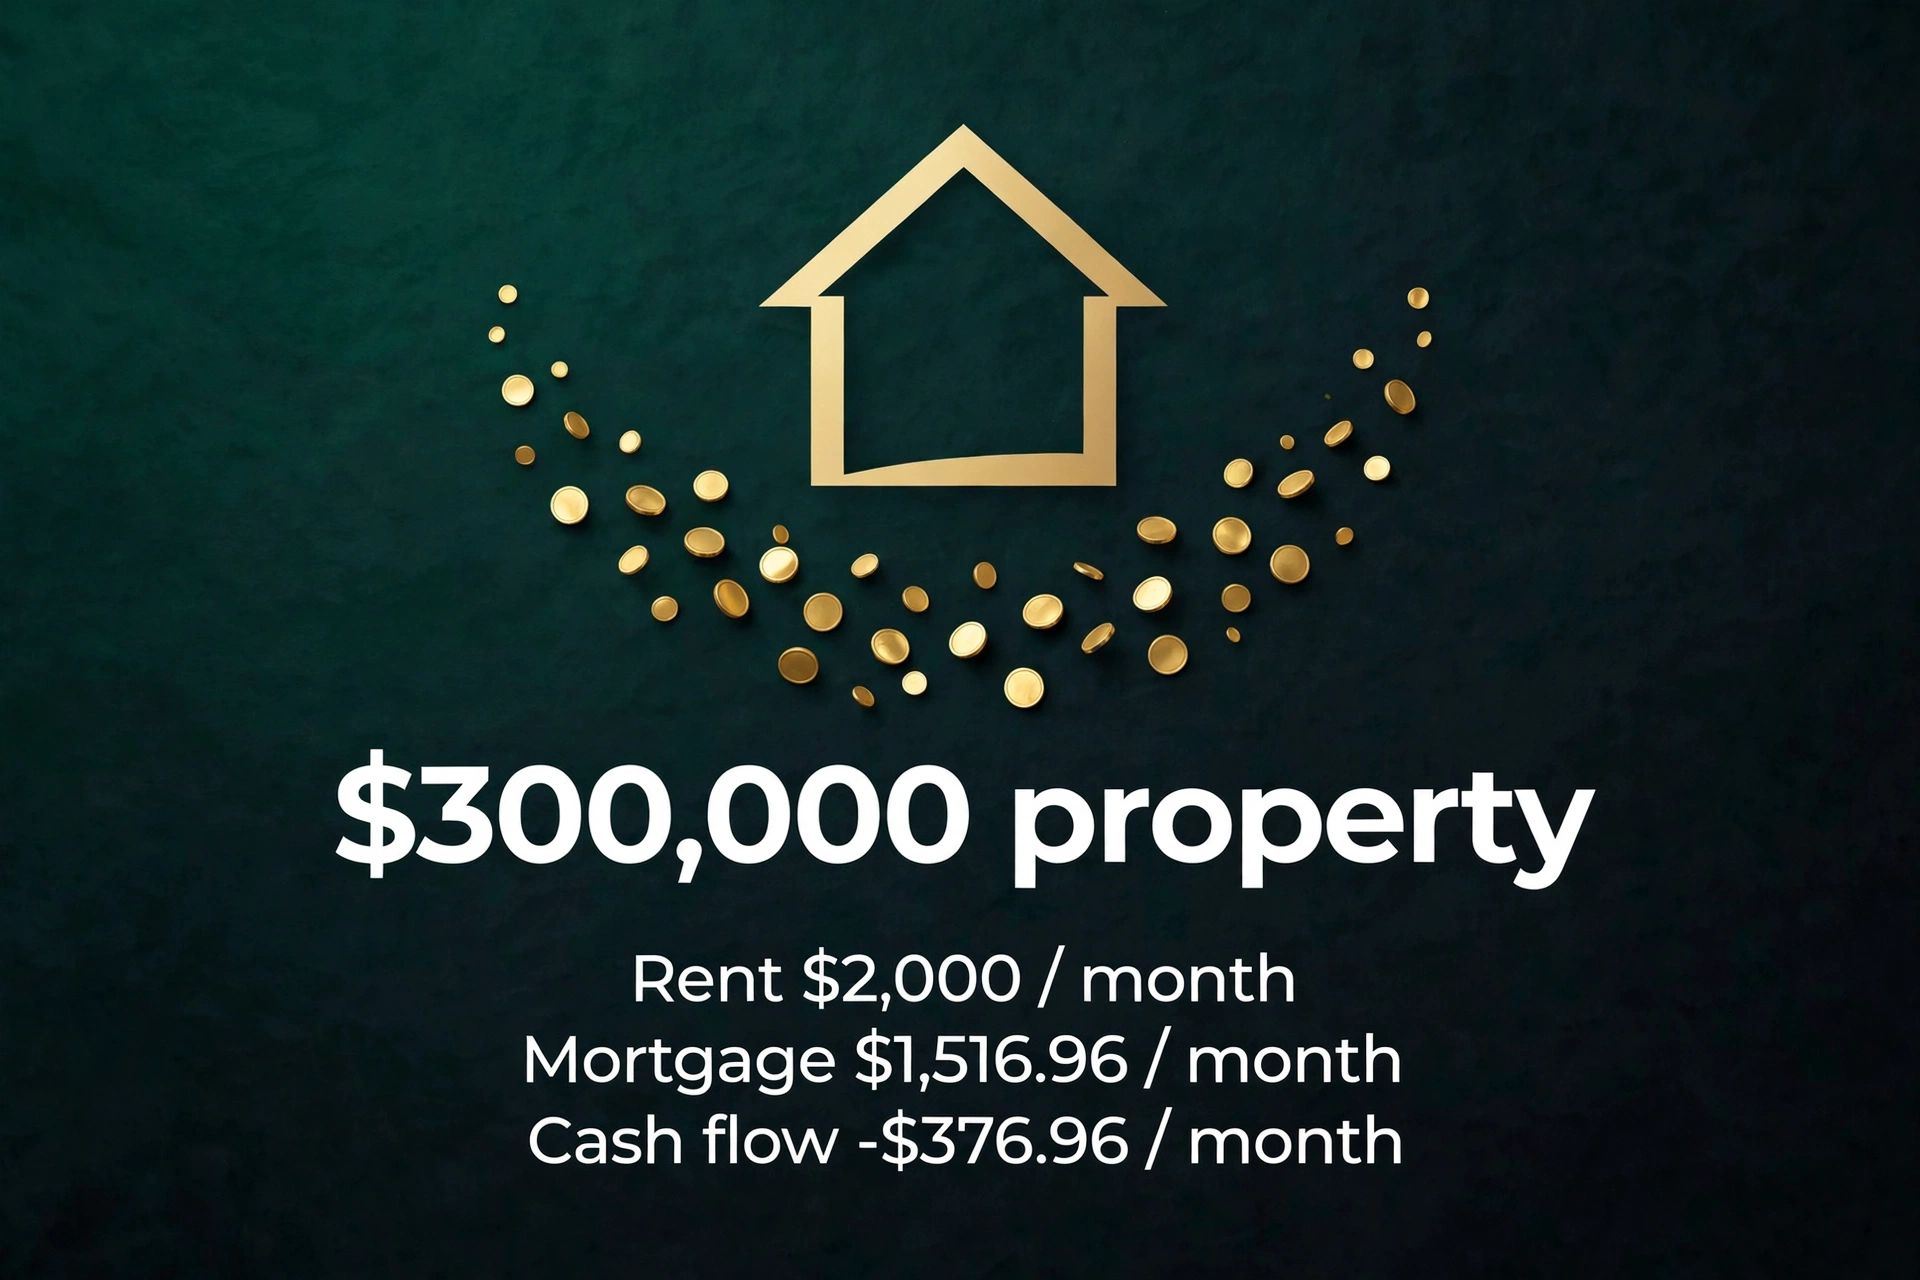
An investment property calculator works out whether a rental property pays for itself each month from the price, the rent, the mortgage, and the running costs. A $300,000 property with a $60,000 down payment, $2,000 a month in rent, a 6.5% mortgage over 30 years, and $760 a month in operating costs has a monthly cash flow of −$376.96, which means it costs $376.96 a month to hold before tax and before any change in the property value.
How do I use the Investment Property Calculator?
Enter the purchase price first, then the down payment in dollars, not as a percentage. The loan is the price minus the down payment, so a $300,000 price with a $60,000 down payment gives a $240,000 loan. Enter the monthly rent the property is expected to bring in, and any other monthly income, such as parking or laundry income, in the next field. If there is no other income, enter 0.
Enter the mortgage annual rate as a percentage, such as 6.5, and the loan term in years, such as 30. Then enter the monthly running costs: property tax, insurance, HOA fees, and maintenance, each as a dollar amount per month. If a cost does not apply, enter 0 rather than leaving the field blank, so the tool can tell a real zero from a missing figure.
Enter the vacancy allowance and the management fee as percentages of the monthly rent. A vacancy figure of 5 means the tool sets aside 5% of the rent for empty periods, and a management figure of 8 means it sets aside 8% of the rent for a property manager. Press the calculate button and the nine result boxes show the monthly mortgage payment, the total monthly income, the total monthly expenses, the monthly and annual cash flow, the cap rate, the cash-on-cash return, the gross rent multiplier, and the 1% rule check with the figures behind it.
The results are an informational estimate from the figures entered. They are not financial advice, and no part of this page claims a qualified review. If a figure on the page does not match a lender's quote or a tax figure, the lender's document or the tax figure is the one to use, because this tool only works with the numbers typed into it.
What does a worked example look like?
Take the first verified test. The price is $300,000, the down payment is $60,000, the rent is $2,000 a month, other income is $0, the mortgage rate is 6.5% over 30 years, property tax is $300 a month, insurance is $150 a month, HOA is $0, maintenance is $150 a month, vacancy is 5%, and management is 8%. The loan is $300,000 minus $60,000, which is $240,000. The monthly mortgage rate is 0.065 divided by 12, which is 0.0054167, and the term is 360 months. The mortgage payment is $240,000 × 0.0054167 ÷ (1 − (1 + 0.0054167)^−360), which is $1,516.96 a month.
The vacancy allowance is 5% of $2,000, which is $100, and the management fee is 8% of $2,000, which is $160. Total monthly income is $2,000 plus $0 minus $100, which is $1,900.00. Operating expenses are $300 plus $150 plus $0 plus $150 plus $160, which is $760 a month. The monthly NOI is $1,900 minus $760, which is $1,140, and the annual NOI is $1,140 × 12, which is $13,680. Total monthly expenses are $760 plus the $1,516.96 mortgage, which is $2,276.96. Monthly cash flow is $1,140 minus $1,516.96, which is −$376.96, and annual cash flow is −$376.96 × 12, which is −$4,523.56.
The cap rate is $13,680 divided by $300,000, then multiplied by 100, which is 4.56%. Cash-on-cash return is −$4,523.56 divided by the $60,000 down payment, then multiplied by 100, which is −7.54%. The gross rent multiplier is $300,000 divided by $24,000 of annual gross rent, which is 12.50. The 1% rule target is 1% of $300,000, which is $3,000 a month, and the rent of $2,000 is 0.67% of the price, so the check reads Fail.
A second test changes the deal. The price is $200,000, the down payment is $40,000, the rent is $1,600 a month, other income is $100 a month, the rate is 5% over 30 years, tax is $200, insurance is $100, HOA is $50, maintenance is $100, vacancy is 5%, and management is 0%. The loan is $160,000, and the mortgage payment is $858.91 a month. The vacancy allowance is 5% of $1,600, which is $80, and there is no management fee. Total monthly income is $1,600 plus $100 minus $80, which is $1,620. Operating expenses are $200 plus $100 plus $50 plus $100 plus $0, which is $450. Monthly NOI is $1,620 minus $450, which is $1,170, and annual NOI is $14,040. Total monthly expenses are $450 plus $858.91, which is $1,308.91. Monthly cash flow is $1,170 minus $858.91, which is $311.09, and annual cash flow is $3,733.02. The cap rate is $14,040 divided by $200,000, which is 7.02%. Cash-on-cash return is $3,733.02 divided by the $40,000 down payment, which is 9.33%. The gross rent multiplier is $200,000 divided by $19,200 of annual gross rent, which is 10.42. The 1% rule target is $2,000 a month, and the rent of $1,600 is 0.80% of the price, so the check reads Fail even though the cash flow is positive.
A third test passes the 1% rule. The price is $150,000, the down payment is $30,000, the rent is $1,600 a month, other income is $0, the rate is 6% over 30 years, tax is $150, insurance is $80, HOA is $0, maintenance is $80, vacancy is 5%, and management is 0%. The loan is $120,000, and the mortgage payment is $719.46 a month. The vacancy allowance is $80. Total monthly income is $1,600 minus $80, which is $1,520. Operating expenses are $150 plus $80 plus $0 plus $80 plus $0, which is $310. Monthly NOI is $1,520 minus $310, which is $1,210, and annual NOI is $14,520. Total monthly expenses are $310 plus $719.46, which is $1,029.46. Monthly cash flow is $1,210 minus $719.46, which is $490.54, and annual cash flow is $5,886.47. The cap rate is $14,520 divided by $150,000, which is 9.68%. Cash-on-cash return is $5,886.47 divided by the $30,000 down payment, which is 19.62%. The gross rent multiplier is $150,000 divided by $19,200 of annual gross rent, which is 7.81. The 1% rule target is $1,500 a month, and the rent of $1,600 is 1.07% of the price, so the check reads Pass.
What is monthly cash flow, and how is it worked out?
Monthly cash flow is the money left over each month after every cost in this tool has been paid, or the shortfall that has to be covered from elsewhere when the figure is negative. The formula is monthly cash flow equals total monthly income minus total monthly expenses, where total monthly expenses are the operating expenses plus the mortgage payment. In the first test, total monthly income is $1,900, total monthly expenses are $2,276.96, and the difference is −$376.96. A negative cash flow does not mean the arithmetic is wrong. It means the rent and other income, after the vacancy allowance, do not cover the mortgage and the running costs at the figures entered.
Annual cash flow is the monthly figure multiplied by 12. In the first test, −$376.96 × 12 is −$4,523.56 a year. In the second test, $311.09 × 12 is $3,733.02 a year. The annual figure is a simple multiple of the monthly one, because this tool models one steady month repeated twelve times. It does not add rent growth, cost growth, or a rent rise during the year, and the limits section explains why that matters.
Cash flow is the figure that decides whether the property pays for itself month by month. A property can have a positive cap rate and still have negative cash flow, because cap rate leaves the mortgage out and cash flow puts it back in. The first test shows exactly that: the cap rate is 4.56%, which is positive, while the cash flow is −$376.96 a month, because the $1,516.96 mortgage is larger than the $1,140 monthly NOI. Read the two figures together, and the reason for the difference is visible in the mortgage box.
What is net operating income (NOI)?
Net operating income, usually shortened to NOI, is the property's income after its operating expenses and before its mortgage. The formula is NOI equals total monthly income minus monthly operating expenses, where operating expenses are property tax, insurance, HOA fees, maintenance, and the management fee. The vacancy allowance is already taken off the income side before NOI is worked out, because rent that is never collected is not income. In the first test, total monthly income is $1,900, operating expenses are $760, and monthly NOI is $1,140.
NOI is the building block for cap rate, and it is also the step that separates the property from the way it is financed. Two buyers can look at the same property, with the same rent and the same running costs, and arrive at the same NOI, even if one pays cash and the other borrows most of the price. Their cash flows will differ, because their mortgage payments differ, but their NOI will be the same. That is the point of the measure: it describes the property, not the loan.
NOI in this tool is a monthly figure multiplied by 12 for the annual figure used in the cap rate. The annual NOI in the first test is $13,680, in the second test it is $14,040, and in the third test it is $14,520. Notice that the second and third tests have higher annual NOI than the first, even though their prices are lower, because their rents are high relative to their costs. NOI on its own does not say whether a deal is good. It has to be divided by the price, which is what the cap rate does, and set against the mortgage, which is what cash flow does.
What is cap rate, and what does it tell me?
Cap rate, short for capitalisation rate, is annual NOI divided by the purchase price, multiplied by 100 to give a percentage. The formula is cap rate equals annual NOI divided by purchase price × 100. In the first test, $13,680 divided by $300,000 is 4.56%. In the second test, $14,040 divided by $200,000 is 7.02%. In the third test, $14,520 divided by $150,000 is 9.68%. The third property returns more income per dollar of price than the first, which is why its cap rate is higher.
Cap rate is most useful as a comparison between properties, because it removes financing from the picture. A buyer comparing two properties at the same price can see at a glance which one produces more NOI for that price. A buyer comparing properties at different prices can still compare them, because the cap rate is a percentage of the price rather than a dollar amount. The same property keeps the same cap rate when the down payment changes, as long as the rent and costs stay the same, which the down-payment section below shows with computed figures.
Cap rate does not include the mortgage, the tax position, appreciation, or the cost of buying. A property with a high cap rate can still lose money each month if the mortgage rate is high or the loan is large, as the first test shows. A property with a low cap rate can still be the one a buyer prefers for reasons outside this tool, such as its location or condition, but those reasons are not in the calculation and this page does not score them. Use cap rate to compare income against price, and use cash flow to test whether the deal pays for itself after the loan.
What is cash-on-cash return, and how does the down payment change it?
Cash-on-cash return is annual cash flow divided by the cash invested, multiplied by 100 to give a percentage. The formula is cash-on-cash return equals annual cash flow divided by total cash invested × 100. In this tool, total cash invested is the down payment only, and closing costs are excluded. That exclusion is stated in the tool, in this section, and in the limits section, because other calculators include closing costs in the same figure and the two versions are not comparable. In the first test, −$4,523.56 divided by $60,000 is −7.54%. In the second test, $3,733.02 divided by $40,000 is 9.33%. In the third test, $5,886.47 divided by $30,000 is 19.62%.
The down payment changes cash-on-cash return in two directions at once, and the same $300,000 property from the first test shows how. With a $30,000 down payment, which is 10% of the price, the loan is $270,000, the mortgage is $1,706.58 a month, monthly cash flow is −$566.58, annual cash flow is −$6,799.00, and cash-on-cash return is −22.66%. With the original $60,000 down payment, which is 20% of the price, the mortgage is $1,516.96 a month, monthly cash flow is −$376.96, annual cash flow is −$4,523.56, and cash-on-cash return is −7.54%. With a $120,000 down payment, which is 40% of the price, the loan is $180,000, the mortgage is $1,137.72 a month, monthly cash flow is $2.28, annual cash flow is $27.33, and cash-on-cash return is 0.02%.
A larger down payment shrinks the mortgage, which improves the monthly cash flow, but it also increases the cash invested, which is the divisor in the return. In this example the cash-flow gain wins at first, moving the return from −22.66% to −7.54% to 0.02%, but the cap rate stays at 4.56% and the gross rent multiplier stays at 12.50 in all three cases, because neither of those measures uses the down payment. That is the cleanest way to see the difference between the metrics: cap rate and GRM describe the property, while cash-on-cash return describes the deal as financed.
What is the gross rent multiplier (GRM)?
The gross rent multiplier is the purchase price divided by the annual gross rent. The formula is GRM equals purchase price divided by annual gross rent, where annual gross rent is the monthly rent multiplied by 12. Other monthly income is not included in the GRM, because the measure is defined on rent alone. In the first test, $300,000 divided by $24,000 is 12.50. In the second test, $200,000 divided by $19,200 is 10.42. In the third test, $150,000 divided by $19,200 is 7.81.
GRM answers a narrow question: how many years of gross rent would it take to equal the purchase price. A GRM of 12.50 means twelve and a half years of gross rent equal the price. A GRM of 7.81 means just under eight years. A lower GRM means the buyer is paying less for each dollar of rent, which is why a lower GRM is generally read as cheaper relative to income. The comparison only works between properties in the same area with similar costs, because GRM ignores every expense. A property with low rent and low costs can have the same GRM as a property with high rent and high costs, and the two will have very different cash flows.
GRM and the 1% rule are the same relationship seen from opposite sides. A property that passes the 1% rule, with monthly rent at 1% of the price, has annual gross rent of 12% of the price, and its GRM is 100 divided by 12, which is 8.33. The third test passes the 1% rule and has a GRM of 7.81, which is below 8.33. The first test fails the rule and has a GRM of 12.50, which is above 8.33. Use GRM for a fast first comparison between listings, then run the full cash-flow figures before judging a deal.
What is the 1% rule, and does passing it mean the deal works?
The 1% rule is a screening check: monthly rent should be at least 1% of the purchase price. The formula is monthly rent divided by purchase price × 100, and the check passes when that figure is 1.00% or more. The target rent is the price multiplied by 0.01. For a $300,000 property the target is $3,000 a month. For a $200,000 property the target is $2,000 a month. For a $150,000 property the target is $1,500 a month. The tool shows the actual rent, the target rent, and the rent as a percentage of the price, so the pass or fail is never a bare label.
Passing the rule does not mean the deal works, and failing it does not mean the deal fails. The second test fails the rule, with rent at 0.80% of the price, and still has a positive monthly cash flow of $311.09, because its costs are low and its mortgage rate is 5%. The third test passes the rule, with rent at 1.07% of the price, and has a positive monthly cash flow of $490.54. A property can pass the rule and still lose money if its taxes, HOA fees, or insurance are high, because the rule looks at rent and price only and ignores every cost. A property can fail the rule and still pay for itself if its costs are low and its mortgage is cheap, as the second test shows.
Treat the 1% rule as a filter for which listings deserve a full calculation, not as a verdict. Run the rent through the tool, then read the cash flow, the cap rate, and the cash-on-cash return. If the rule and the cash flow disagree, trust the cash flow, because it uses the costs and the mortgage that the rule leaves out.
What counts as income, and what counts as an expense?
Income in this tool is rent plus other monthly income, minus the vacancy allowance. Rent is the monthly rent the property is expected to bring in when it is occupied. Other monthly income covers regular amounts beyond rent, such as parking fees, laundry income, or a pet fee charged every month. A one-off amount, such as a deposit, is not monthly income and should not be entered here. The vacancy allowance is taken off the rent before the income total is struck, because a month with no tenant produces no rent.
Expenses in this tool fall into two groups, and the tool keeps them separate before adding them together. Operating expenses are property tax, insurance, HOA fees, maintenance, and the management fee. The mortgage payment is a financing expense, not an operating expense. Total monthly expenses, the figure in the third result box, are operating expenses plus the mortgage payment. In the first test, operating expenses are $760, the mortgage is $1,516.96, and total monthly expenses are $2,276.96.
For the mortgage payment itself, the tool uses the loan calculator formula: a standard amortising payment where each monthly payment covers interest for that month plus part of the loan balance. With a rate above zero, the payment is loan × monthly rate ÷ (1 − (1 + monthly rate)^−months). With a rate of zero, the payment is the loan divided by the number of months, which is $666.67 a month on a $240,000 loan over 360 months. The payment stays the same every month in this tool, because the rate and term are fixed for the whole loan.
How do vacancy and management allowances work?
A vacancy allowance is a share of the rent set aside for the periods when the property is empty, between tenants or during repairs that stop it being let. The tool takes it as a percentage of the monthly rent. At 5% vacancy on $2,000 of rent, the allowance is $100 a month, which is $1,200 a year. That is the same as assuming the property is empty for about eighteen days a year on average, spread across the year as a monthly allowance rather than as whole empty months. At 100% vacancy, the allowance is the whole $2,000, total monthly income falls to $0 when other income is $0, monthly NOI falls to −$760, and monthly cash flow falls to −$2,276.96, because the operating expenses and the mortgage still have to be paid with no income coming in. That edge case is in the verified tests table, and it shows why the allowance is not a small detail.
A management fee is a share of the rent paid to a property manager, and the tool also takes it as a percentage of the monthly rent. At 8% management on $2,000 of rent, the fee is $160 a month. At 0%, as in the second and third tests, the fee is $0 and the owner is assumed to manage the property without paying a manager. The fee is an operating expense, so it reduces NOI and cash flow, and it is included in the operating-expenses total. If a manager charges a flat monthly amount instead of a percentage, convert it before entering it: divide the flat amount by the monthly rent and multiply by 100 to get the percentage to enter.
Both allowances scale with the rent, so a rent rise also raises the dollar amounts set aside. In the rent-sensitivity table below, the vacancy allowance rises from $90 a month at $1,800 rent to $110 a month at $2,200 rent, and the management fee rises from $144 to $176. The net gain from a rent rise is therefore less than the full rise, because part of each extra dollar of rent is set aside for vacancy and management before it reaches the cash flow.
Why is the mortgage left out of NOI but included in cash flow?
The mortgage is left out of NOI because NOI is meant to describe the property, and the mortgage describes the buyer. Two buyers can buy the same property at the same price, with the same rent and the same running costs, and their NOI will be identical, even if one pays cash and the other borrows 80% of the price. The buyer who pays cash has no mortgage payment at all. The buyer who borrows has a large one. If NOI included the mortgage, the same property would have a different NOI for each buyer, and the measure could not be used to compare properties. Keeping the mortgage out is what lets cap rate compare properties on equal terms.
The mortgage is included in cash flow because cash flow is meant to describe the buyer's month, and the mortgage is the largest amount most buyers pay each month. A property with a healthy NOI can still cost its owner money every month when the mortgage is larger than the NOI, as the first test shows: monthly NOI is $1,140, the mortgage is $1,516.96, and the shortfall is $376.96. Leaving the mortgage out of cash flow would hide that shortfall and present a property that costs money as one that pays. The two measures answer different questions, and the tool shows both so neither question is answered with the other's figure.
The same split applies to the down payment. The down payment does not appear in NOI or in cap rate at all, because it is a financing choice. It appears in cash-on-cash return, because that return is measured against the cash the buyer put in. A cash buyer, with no mortgage and a down payment equal to the whole price, would have monthly cash flow equal to monthly NOI and a cash-on-cash return equal to the cap rate. A buyer with a small down payment has a larger mortgage, a smaller cash flow, and a cash-on-cash return that can be far above or far below the cap rate, depending on whether the cash flow is positive or negative.
How much does rent change the result?
Rent is the input that moves the result fastest, because it changes the income, the vacancy allowance, the management fee, and every figure built on them, while the mortgage stays fixed. The table below holds the first test's property fixed — $300,000 price, $60,000 down payment, 6.5% over 30 years, tax $300, insurance $150, HOA $0, maintenance $150, vacancy 5%, management 8% — and changes only the monthly rent. Every cell was computed with Node from the same formulas the tool uses.
| Monthly rent | Total monthly income | Operating expenses | Monthly NOI | Monthly cash flow | Annual cash flow | Cap rate | Cash-on-cash return | GRM |
|---|---|---|---|---|---|---|---|---|
| $1,800 | $1,710.00 | $744.00 | $966.00 | −$550.96 | −$6,611.56 | 3.86% | −11.02% | 13.89 |
| $2,000 | $1,900.00 | $760.00 | $1,140.00 | −$376.96 | −$4,523.56 | 4.56% | −7.54% | 12.50 |
| $2,200 | $2,090.00 | $776.00 | $1,314.00 | −$202.96 | −$2,435.56 | 5.26% | −4.06% | 11.36 |
A $200 rise in rent, from $1,800 to $2,000, lifts monthly cash flow by $174.00, from −$550.96 to −$376.96. The same $200 rise from $2,000 to $2,200 lifts it by the same $174.00, from −$376.96 to −$202.96. The gain is less than $200 because the vacancy allowance and the management fee take 13% of each extra dollar of rent between them: 5% for vacancy and 8% for management. After those two allowances, $174.00 of each $200 rise reaches the cash flow. The mortgage does not change at all across the table, because it depends on the price, the down payment, the rate, and the term, none of which move.
The table also shows that this property stays cash-flow negative across the whole rent range shown, from $1,800 to $2,200 a month. A rent of $2,200 still leaves a shortfall of $202.96 a month. The rent that would bring monthly cash flow to exactly zero on these figures is $2,433.29 a month, found by working backwards: the mortgage plus operating costs at that rent must equal the income after vacancy, and the vacancy and management allowances both rise with the rent, so the break-even rent is higher than the simple sum of the costs. That figure is a computed result for the stated assumptions, not a market rent, and it is given here so a reader can see how far the rent in the table is from break-even rather than guessing from the trend.
What mistakes do people commonly make with investment property figures?
The first mistake is using gross rent as profit. Gross rent is the starting figure, not the amount the owner keeps. Vacancy, management, tax, insurance, HOA fees, maintenance, and the mortgage all come off it before the owner sees a dollar. In the first test, gross rent is $2,000 a month and monthly cash flow is −$376.96. The gap between those two figures is $2,376.96 a month of costs and allowances. Reading the rent as the return overstates the deal by that whole amount.
The second mistake is forgetting vacancy and maintenance. A property that is let for eleven months of the year and empty for one month loses about 8.3% of its annual rent to vacancy, and a property that needs a repair every year or two has a real maintenance cost even in the months when nothing breaks. Entering 0 for vacancy and 0 for maintenance makes the cash flow look better than it is, and the shortfall appears later as an empty month or a repair bill. The tool asks for both figures as separate inputs so neither one is silently left at zero.
The third mistake is ignoring the HOA fee. An HOA fee of a few hundred dollars a month changes the cash flow by that amount every month, and it is not optional while it applies. In the second test, the HOA fee is $50 a month. A fee of $300 a month on the same property would cut monthly cash flow by a further $250 and annual cash flow by $3,000, with no change to the rent or the mortgage. Enter the fee from the HOA's own documents, and check whether it is expected to change.
The fourth mistake is judging a deal by one metric alone. Cap rate ignores the mortgage. Cash-on-cash return depends on the down payment. GRM ignores every expense. The 1% rule ignores every cost. Each metric answers one question, and a deal can look good on one of them and poor on another. The second test fails the 1% rule and still pays $311.09 a month. The first test has a positive cap rate and still costs $376.96 a month. Read all nine result boxes together, and check that the story they tell agrees before going further.
The fifth mistake is entering the down payment as a percentage. The tool asks for the down payment in dollars, because the loan is the price minus the down payment and a percentage entered as dollars would give a loan that is far too large. A $60,000 down payment entered as 20 would give a loan of $299,980 on a $300,000 price, which is not the deal the reader meant. If the down payment is known as a percentage, multiply it by the price first: 20% of $300,000 is $60,000. For a related percentage calculation, see the percentage calculator.
What does this calculator leave out?
This calculator does not model appreciation, which is a change in the property value over time. A property that loses $376.96 a month in cash flow could still gain value over years, and a property that pays $311.09 a month could lose value, but neither outcome is in the figures on this page. The same applies to rent growth and cost growth: the tool models one steady month repeated twelve times, with the same rent, the same costs, and the same mortgage payment in every month. Real rents and costs change over time, and the tool does not predict how.
Closing costs are not included. Total cash invested in this tool is the down payment only. Closing costs, such as lender fees, title costs, and legal fees, are real money paid at purchase, and leaving them out makes the cash-on-cash return higher than a version that includes them, because the divisor is smaller. The exclusion is stated in the tool and in the article so the figure is not compared with a version that includes them as if they were the same measure.
Tax is not included. Rental income, mortgage interest, depreciation, and the sale of a property all have tax effects that depend on the owner's country, tax bracket, and circumstances, and this tool does not model any of them. The cash flow on this page is before tax. Depreciation is not an operating expense in this tool, and it is not deducted from the income, because it is a tax calculation rather than a monthly cash cost. Repairs beyond routine maintenance are not included either: a new roof, a new boiler, or a major renovation is a capital cost, not a monthly maintenance figure, and it should be considered separately from the monthly figures here.
The tool also leaves out the principal part of the mortgage as a separate return. Each monthly mortgage payment includes interest and a repayment of part of the loan balance, and the balance falls a little each month. That fall in the balance is a gain in equity, but it is not cash in hand, and this tool does not show it as income. The cash flow figure is the cash left after the whole mortgage payment, principal and interest together, has been paid. For a return figure that compares a gain with the cash put in, see the ROI calculator.
How can I check the tool against my own figures?
The simplest check is to work one test by hand and compare it with the tool. Take the second test: $200,000 price, $40,000 down payment, $1,600 rent, $100 other income, 5% rate over 30 years, $200 tax, $100 insurance, $50 HOA, $100 maintenance, 5% vacancy, 0% management. The loan is $160,000. The monthly rate is 0.05 divided by 12, which is 0.0041667, and the term is 360 months. The mortgage is $160,000 × 0.0041667 ÷ (1 − (1 + 0.0041667)^−360), which is $858.91. The vacancy allowance is $80, total monthly income is $1,620, operating expenses are $450, monthly NOI is $1,170, total monthly expenses are $1,308.91, and monthly cash flow is $311.09. If the tool shows those figures, the arithmetic is right for those inputs.
A second check is the zero-rate case. Enter the first test's figures with the rate set to 0%. The mortgage should be the $240,000 loan divided by 360 months, which is $666.67 a month. Total monthly expenses should be $760 plus $666.67, which is $1,426.67. Monthly cash flow should be $1,140 minus $666.67, which is $473.33, and annual cash flow should be $5,680.00. The cap rate should stay at 4.56%, because the rate does not enter the cap rate. If any of those figures differ, check the rate field first: a rate entered as 6.5 means 6.5%, not 0.065, and a rate entered as 0.065 would be treated as 0.065%.
A third check is the down-payment check. Enter the first test's figures, then change only the down payment from $60,000 to $120,000. The cap rate should stay at 4.56% and the GRM should stay at 12.50, because neither uses the down payment. The mortgage should fall from $1,516.96 to $1,137.72, monthly cash flow should rise from −$376.96 to $2.28, and cash-on-cash return should move from −7.54% to 0.02%. If the cap rate moves when only the down payment changes, a figure has been entered in the wrong field. For the mortgage payment on its own, the loan calculator gives the same amortising payment from the loan amount, rate, and term. For the take-home side of a household budget, the take home pay calculator works out net pay after deductions. More tools in the same collection are in the calculators category.
Frequently asked questions
How do I calculate cash flow on an investment property?
Subtract total monthly expenses from total monthly income. Total monthly income is rent plus other income minus the vacancy allowance. Total monthly expenses are operating expenses — tax, insurance, HOA, maintenance, and management — plus the mortgage payment. On a $200,000 property with $1,600 rent, $100 other income, 5% vacancy, $450 operating expenses, and an $858.91 mortgage, monthly cash flow is $1,620 minus $1,308.91, which is $311.09.
What is cap rate, and how is it calculated?
Cap rate is annual net operating income (NOI) divided by the purchase price, multiplied by 100. NOI is total monthly income minus monthly operating expenses, excluding the mortgage, multiplied by 12. On a $300,000 property with annual NOI of $13,680, the cap rate is $13,680 divided by $300,000, which is 4.56%. It describes the property, not the financing, so it does not change when the down payment changes.
What is cash-on-cash return?
Cash-on-cash return is annual cash flow divided by total cash invested, multiplied by 100. In this tool, total cash invested is the down payment only, with closing costs excluded. On a $200,000 property with a $40,000 down payment and annual cash flow of $3,733.02, cash-on-cash return is $3,733.02 divided by $40,000, which is 9.33%. A larger down payment lowers the mortgage and improves cash flow, but it also increases the cash invested, so the return does not rise in proportion to the cash flow.
What is the 1% rule in real estate?
The 1% rule says monthly rent should be at least 1% of the purchase price. A $150,000 property needs $1,500 a month in rent to pass, and a $300,000 property needs $3,000 a month. It is a quick screen, not a verdict: a property can fail the rule and still have positive cash flow, as the $200,000 test shows with rent at 0.80% of the price and monthly cash flow of $311.09, and a property can pass the rule and still lose money if its costs are high.
What is gross rent multiplier (GRM)?
GRM is the purchase price divided by annual gross rent, where annual gross rent is monthly rent multiplied by 12. On a $150,000 property with $1,600 monthly rent, annual gross rent is $19,200 and GRM is $150,000 divided by $19,200, which is 7.81. A lower GRM means less is paid for each dollar of rent. GRM ignores every expense, so it is a first comparison between listings, not a substitute for the cash-flow figures.
Why is my cap rate positive but my cash flow negative?
Cap rate leaves the mortgage out, and cash flow puts it back in. Monthly NOI can be positive while the mortgage is larger than the NOI, which gives negative cash flow. On the $300,000 test, monthly NOI is $1,140, the mortgage is $1,516.96, and monthly cash flow is $1,140 minus $1,516.96, which is −$376.96. The cap rate of 4.56% is still positive, because it is based on the NOI alone. The two figures answer different questions, and both are shown so the difference is visible.