XIRR Calculator
XIRR Calculator
Paste your dated cash flows and get the annualised return, total return and MOIC.
Use YYYY-MM-DD dates. Money you put in is a negative number; money you got back — including the current value of the investment — is a positive number. You need at least two lines, with at least one of each sign.
An XIRR calculator finds the annualised return on money that moved in and out on different dates. Paste each cash flow with its date — money you put in as a negative number, money you got back as a positive number — and it returns the single yearly rate that makes all of those flows balance to zero.
What is XIRR?
XIRR stands for Extended Internal Rate of Return. It is the yearly return on an investment where money goes in and comes out on irregular dates: monthly contributions to a fund, a lump sum followed by a part withdrawal, rent arriving whenever it arrives, or capital calls and distributions from a private fund. Each cash flow counts for exactly as long as it was invested, so a contribution made last month carries less weight than one made three years ago.
The "extended" part is the dates. The older IRR measure assumes every cash flow lands at the end of an equal period — year one, year two, year three. Real investments do not work that way. Money moves on the 14th of March, on a Tuesday in July, or whenever a tenant pays. XIRR takes the actual calendar date of every movement and builds the return from those dates, which is why fund statements and investment platforms report SIP and portfolio returns as XIRR rather than as a simple percentage gain.
XIRR is a money-weighted return. That phrase means the result depends on both the size of each flow and when it happened. Two investors in the same fund can have different XIRRs if one of them added money just before a rise and the other added money just before a fall. The number describes your own experience with the investment, not the fund's published performance. Keep that distinction in mind when you compare your XIRR with a fund's advertised return — the two are measuring different things.
How does the XIRR formula work?
XIRR is the rate r that makes the net present value of all the cash flows equal to zero. Written out, the equation is: 0 = Σ [CashFlow ÷ (1 + r)^((date − first date) ÷ 365)]. Every amount is divided by (1 + r) raised to the number of days since the first cash flow, divided by 365. Amounts that arrive later are discounted more heavily, because a dollar received next year is worth less than a dollar received today at any positive rate.
There is no way to rearrange that equation and solve for r directly once there are more than two flows. Spreadsheets and calculators find the rate by iteration instead: they guess a rate, work out the sum, adjust the guess, and repeat until the sum is close enough to zero. Excel starts at a 10% guess and refines it with the Newton-Raphson method until the result is accurate within 0.000001 percent, trying up to 100 times before giving up. This calculator does the same thing, starting from 10% and switching to bisection — halving the gap between two rates that bracket the answer — if the Newton steps fail to settle.
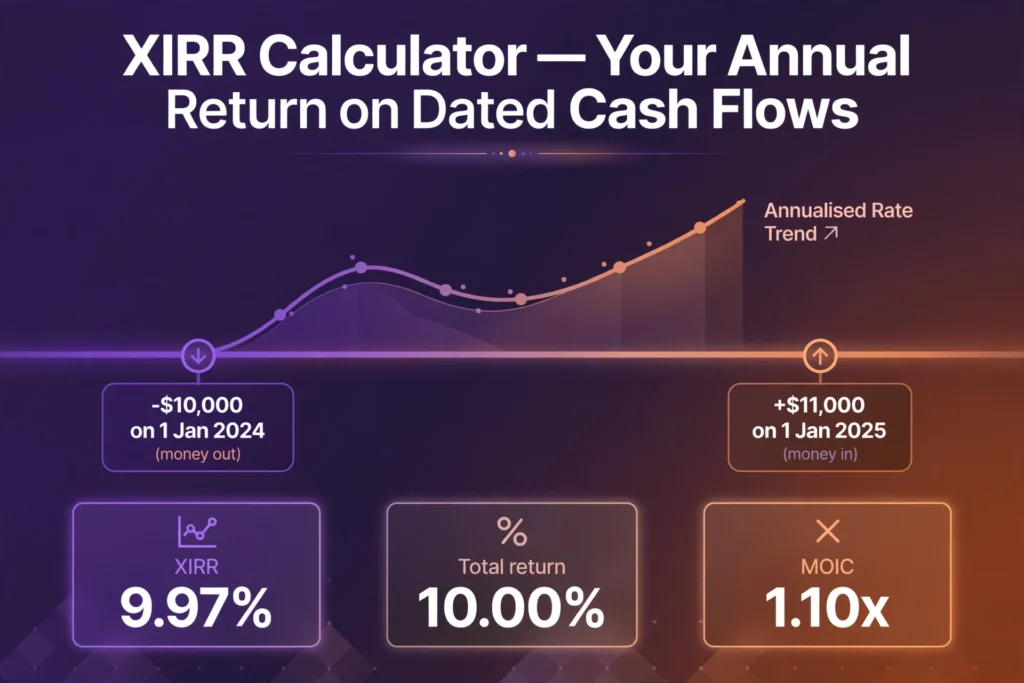
The day count matters, and it is exact. XIRR uses a 365-day year, so the exponent is the real number of days between dates divided by 365. A leap year changes the answer: $10,000 invested on 1 January 2024 and returned as $11,000 on 1 January 2025 sat invested for 366 days, not 365, so the XIRR is 9.97% rather than 10.00%. The total gain is still exactly 10.00% — only the annualised rate moves, because the same gain was spread over one extra day. Small differences like that are the whole point of XIRR: it refuses to round the timing away.
The sign convention is part of the formula, not a display choice. Money going out is negative and money coming back is positive, and there must be at least one of each. If every flow has the same sign, no rate can make the sum zero, and Excel answers with a #NUM! error. This calculator says the same thing in plain words instead of showing an error code.
How is XIRR different from IRR?
The difference between XIRR and IRR is the calendar. IRR assumes every cash flow arrives at the end of an equal period, usually a year or a month, and it cannot tell a January payment from a December one. XIRR pairs each amount with its own date and discounts it by the exact number of days. When the flows really do land on a tidy schedule, the two give the same answer. When they do not, XIRR is the one that matches reality.
Take a simple case: $10,000 goes in on 1 January 2023, $5,500 comes back on 1 July 2023, and $6,000 comes back on 1 January 2024. The XIRR is 20.39%. An IRR calculation would have to force those flows into whole years — perhaps treating the July payment as a full-year flow — and would give a different, less honest number. The mid-year payment matters because money returned after six months can be put to work again sooner than money returned after twelve.
CAGR is a third measure that often gets mixed up with both. CAGR, the compound annual growth rate, needs exactly one lump sum in and one lump sum out, and it tells you the steady yearly rate that connects them. It cannot handle extra contributions, withdrawals, or a current value part-way through. If your investment has more than two movements, CAGR cannot describe it at all, and XIRR is the right tool. If it has exactly two movements — one in, one out — XIRR and CAGR agree, because the equation collapses to the same calculation.
The practical rule is simple. Use IRR when the payments fall on a fixed schedule and you already know the periods. Use XIRR whenever the dates are irregular, which covers most real investments. Use CAGR only for a single lump sum held untouched. Picking the wrong one does not just change the number — it changes what the number means.
What is MOIC, and how does it relate to XIRR?
MOIC stands for Multiple on Invested Capital. It is the total amount returned divided by the total amount invested, with no adjustment for time. Put in $10,000, get back $11,500, and the MOIC is 1.15x. The same arithmetic appears under other names — equity multiple in property deals, TVPI in fund reporting — but the idea is identical: how many dollars came back for each dollar that went in.
MOIC and XIRR answer different questions, and that is why this calculator shows both. XIRR measures speed: how fast the money grew per year. MOIC measures size: how much money came back in total. A 1.50x MOIC reached in one year is a 50.00% XIRR; the same 1.50x reached over ten years is only a 4.14% XIRR. The multiple is identical and the investment is not — one doubled your money in twelve months and the other took a decade.
| Years held | XIRR for a 1.50x MOIC |
|---|---|
| 1 | 50.00% |
| 2 | 22.47% |
| 3 | 14.47% |
| 4 | 10.67% |
| 5 | 8.45% |
| 7 | 5.96% |
| 10 | 4.14% |
Read the two numbers together. A high XIRR with a low MOIC can mean a quick, small win — a 1.05x multiple in six months annualises to 10.28%, which looks strong until you see that the total gain was only 5.00%. A high MOIC with a modest XIRR can mean a large gain that took a long time to arrive. Fund managers quote both for exactly this reason: either number on its own can flatter a result that the other would expose. The total return percentage sits between them — it is the gain as a share of what went in (15.00% when $10,000 becomes $11,500), with no time adjustment, like MOIC expressed as a percentage.
How do you calculate XIRR in Excel?
You need two columns and one formula. Put the dates in one column and the matching cash flows in the next, with money you put in as negative numbers and money you got back — including the current value of the investment on today's date — as positive numbers. Then, in an empty cell, type =XIRR(values, dates). Excel and Google Sheets use the same order: amounts first, dates second. Format the cell as a percentage and the result is your annualised return.
A short example makes the layout clear. Dates go in A2:A3 (2024-01-01 and 2025-01-01) and amounts in B2:B3 (−10000 and 11000). The formula =XIRR(B2:B3, A2:A3) returns 9.97%. Add a third row — 2023-07-01 with 5500, and 2024-01-01 with 6000 — and the same formula over the longer range returns 20.39%. The function accepts an optional third argument, a guess: =XIRR(B2:B4, A2:A4, 0.15) starts the search at 15% instead of the default 10%, which can help when Excel struggles to settle.
Excel has four rules that catch people out. First, the values must contain at least one positive and one negative number, or the function returns #NUM!. Second, the first date in the range must be the earliest date — later rows can sit in any order, but nothing may come before that first date. Third, every date must be a real date, not text that looks like one; a date stored as text gives a #VALUE! error. Fourth, if the search does not settle within 100 iterations, Excel returns #NUM! rather than a wrong number, and trying a different guess is the usual fix. Google Sheets follows the same rules with the same syntax.
What is a good XIRR?
There is no single number that counts as good, because a good XIRR depends on what the money was invested in and over what period. Published guides often quote 12–15% a year as strong for equity funds and 6–8% for debt funds, based on long-run Indian market returns, and those bands are a reasonable starting point for a fund investor. But a rental property, a private loan, a term deposit and a stock fund do not share a benchmark, and comparing their XIRRs directly is comparing different risks.
The honest way to judge an XIRR is against two yardsticks. The first is inflation: a return below inflation means the money lost buying power even though the balance grew. The second is a relevant alternative — the return on a broad market index over the same dates, or the rate on a deposit over the same period. An XIRR of 9% looks weak next to a 12% index return over the same years, and strong next to a 5% deposit rate. The comparison only works when the dates match, because XIRR is tied to the exact days the money moved. Once you have a realistic long-run rate in mind, how much you can withdraw each year in retirement turns that rate into an income plan.
Time changes the meaning of the number as well. Over one year, an XIRR mostly reflects luck and timing. Over five or ten years, it starts to reflect the quality of the investment. The table below shows what $10,000 becomes at a steady XIRR over different periods — the same rate, held longer, builds far more, which is why a modest rate sustained for a decade beats a spectacular rate that lasts a year.
| XIRR | After 1 year | After 3 years | After 5 years | After 10 years |
|---|---|---|---|---|
| 5% | $10,500 | $11,576 | $12,763 | $16,289 |
| 8% | $10,800 | $12,597 | $14,693 | $21,589 |
| 10% | $11,000 | $13,310 | $16,105 | $25,937 |
| 12% | $11,200 | $14,049 | $17,623 | $31,058 |
| 15% | $11,500 | $15,209 | $20,114 | $40,456 |
One more caution: an XIRR is a backward-looking measure. It describes what happened to money that already moved, on dates that already passed. It says nothing about what the same investment will earn next year, and a high past XIRR can come from a single lucky exit rather than a repeatable pattern. Use it to understand your own history, not to predict the future.
When does XIRR give a misleading answer?
XIRR is exact about dates and silent about everything else, and that silence is where the traps sit. The first trap is short periods. A 5.00% gain over 182 days annualises to 10.28%, and a 5.00% gain over a single month annualises to roughly 79%. The maths is correct — that is what the gain would be worth if it repeated every month for a year — but it almost never repeats, so a short-period XIRR flatters the investment. For any holding under twelve months, read the total return and the MOIC first and treat the XIRR as a rough guide.
The second trap is the reinvestment assumption. XIRR assumes every dollar that comes back can be reinvested at the same rate as the XIRR itself. When the XIRR is 20%, the maths quietly assumes the $5,500 that came back in July earns 20% for the rest of the year. In real life it probably earns whatever a bank account or the next investment pays, which is usually less. The higher the XIRR, the more this assumption overstates the result. The modified internal rate of return, or MIRR, exists to fix this by using separate rates for reinvestment, but spreadsheets do not offer it as a one-step function the way they offer XIRR.
The third trap is a cash-flow list that changes sign more than once — money in, money out, money in again, money out again. Such a list can have more than one rate that makes the sum zero, and the answer you get depends on where the search starts. This calculator scans for a sign change and narrows it down by bisection if the Newton steps fail, and it found a 165.13% rate for a four-flow list that swings between negative and positive. Treat any XIRR from a list like that with care, and check the MOIC and total return alongside it: they do not have this problem.
The fourth trap is what XIRR leaves out. It does not include tax, fees, or exit charges unless the amounts you enter are already after those costs. A fund XIRR of 14% that ignores a 1% annual fee and a capital-gains bill is not the return you kept. It also ignores risk entirely — a 20% XIRR on a loan to a shaky borrower and a 20% XIRR on a government bond are the same number for very different investments. Enter net amounts, read the MOIC next to the rate, and remember that no single percentage can carry risk, tax, and timing at once.
How do you use this XIRR calculator?
Paste one cash flow per line, with the date first and the amount second, separated by a space or a comma. Write dates as YYYY-MM-DD, for example 2024-01-01. Write money you put in as a negative number, for example −10000, and money you got back as a positive number, for example 11000. If the investment is still open, add its current value as a final positive flow on today's date — that is how a fund statement turns an unrealised gain into an XIRR.
The calculator sorts the flows by date, checks that there are at least two of them with at least one of each sign, and then solves for the rate. The result boxes show the XIRR per year, the total return, the MOIC, the total invested, the total returned, and the number of cash flows. The calculation runs as you type, so you can change a date or an amount and watch the rate move. If a line cannot be read, or the flows have no valid rate, the calculator explains the problem in plain words instead of showing an error code. For a single lump sum held untouched, the total return on a single investment is a simpler check, and how steady growth compounds over time shows what a steady rate builds over the years.
What does a worked XIRR example look like?
Start with the simplest case: $10,000 invested on 1 January 2024 and $11,000 received back on 1 January 2025. The calculator returns an XIRR of 9.97%, a total return of 10.00%, and a MOIC of 1.10x. The total return is the plain gain — $1,000 on $10,000 — and the MOIC says each dollar came back as $1.10. The XIRR is a touch below 10.00% because 2024 is a leap year: the money was invested for 366 days, so the same $1,000 gain annualises to slightly less than a full 10% a year.
Now add a mid-year payment, which is where XIRR earns its keep. Invest $10,000 on 1 January 2023, receive $5,500 on 1 July 2023, and receive $6,000 on 1 January 2024. The total returned is $11,500, so the total return is 15.00% and the MOIC is 1.15x — the same as if the whole $11,500 had arrived on the last day. But the XIRR is 20.39%, much higher than 15.00%, because $5,500 came back after only 181 days. Money that returns early counts for more in an annualised rate, and XIRR is the measure that captures that.
A third case shows the same idea from the other side. Two instalments of $5,000 — one on 1 January 2023 and one on 1 July 2023 — ending at $11,500 on 1 January 2024 give an XIRR of 20.26%. The total return and MOIC are the same as the previous case, 15.00% and 1.15x, but the XIRR is a little lower, because the second $5,000 was only invested for half the year. The timing of each contribution changes the rate even when the totals do not move. If you want to see what those regular payments would grow to on their own, the future value of regular contributions works it out from the same instalments.
The loss case completes the picture. Invest $10,000 on 1 January 2023 and receive $9,000 on 1 January 2024, and the XIRR is exactly −10.00%, with a total return of −10.00% and a MOIC of 0.90x. A negative XIRR is not an error — it is the honest answer when less money comes back than went in. And a two-year case shows the rate shrinking as time stretches: $10,000 growing to $12,500 over the 731 days from 1 January 2023 to 1 January 2025 is a 25.00% total return and a 1.25x MOIC, but only an 11.79% XIRR, because the gain took two years to arrive.
This page gives general information about XIRR and how the numbers work. It is not financial advice, and it does not take your full situation into account. XIRR assumes cash flows can be reinvested at the same rate, and it does not include tax, fees or inflation unless the amounts you enter are already after those costs. Check the current figures for any investment yourself, or speak to a qualified financial adviser before making a decision.
What is XIRR in simple terms?
XIRR is the yearly return on an investment where money moved in and out on different dates. It is the single annual rate that makes all of your dated cash flows — money in as negative numbers, money back as positive numbers — balance to zero when each is discounted by its exact number of days.
How do I calculate XIRR in Excel?
List the dates in one column and the matching cash flows in the next, with investments as negative numbers and returns as positive numbers. Then type =XIRR(values, dates) — amounts first, dates second — and format the cell as a percentage. Excel needs at least one positive and one negative flow, or it returns #NUM!.
What is the difference between XIRR and IRR?
IRR assumes cash flows arrive at the end of equal periods, such as yearly or monthly. XIRR uses the actual calendar date of each cash flow and discounts it by the exact number of days divided by 365. When the dates are irregular, XIRR is the accurate measure; when the flows fall on a tidy schedule, the two agree.
What is a good XIRR?
It depends on the investment and the period. Published guides often quote 12–15% a year as strong for equity funds and 6–8% for debt funds, but the honest check is against inflation and a relevant alternative over the same dates, such as a market index or a deposit rate. A short-period XIRR can look far better than the total gain behind it.
Can XIRR be negative?
Yes. If you get back less than you put in, the XIRR is negative — for example, $10,000 invested for a year and $9,000 returned gives an XIRR of exactly −10.00%. A negative XIRR is a valid result, not an error, and it goes with a MOIC below 1.00x.
Why does Excel show #NUM! for XIRR?
Excel shows #NUM! when the cash flows are all positive or all negative, when a date falls before the first date in the range, or when the search does not settle within 100 tries. Check the signs first, then check that the first date is the earliest, then try giving Excel a starting guess, such as =XIRR(values, dates, 0.15).