4 Percent Rule Calculator
Choose what you want to work out, then enter your numbers. The 4% rule says you can withdraw 4% of your portfolio in the first year of retirement, then raise that dollar amount by inflation each year. This tool works out the safe annual and monthly withdrawal from a portfolio size, the portfolio you need for a target income, or how long your money lasts at a chosen withdrawal, return and inflation rate.
The 4% rule comes from historical US market data and a 30-year retirement. It is a planning rule of thumb, not a guarantee: it says nothing about what markets will do next. The longevity simulation applies one fixed return every year and takes the withdrawal at the end of each year, after that year’s growth. Real markets vary from year to year, and the order of good and bad years changes the result. Treat the simulation as a planning illustration, not a prediction.
The 4 percent rule is a retirement planning rule of thumb: withdraw 4% of your portfolio in the first year of retirement, then raise that dollar amount by inflation each year, and the money has a high chance of lasting 30 years. This calculator works out the safe annual and monthly withdrawal from a portfolio size, the portfolio you need for a target income, and how long the money lasts at a chosen return and inflation rate.
How do I use the 4 Percent Rule Calculator?
Choose what you want to work out from the dropdown at the top of the tool. There are three choices, and each one answers a different question.
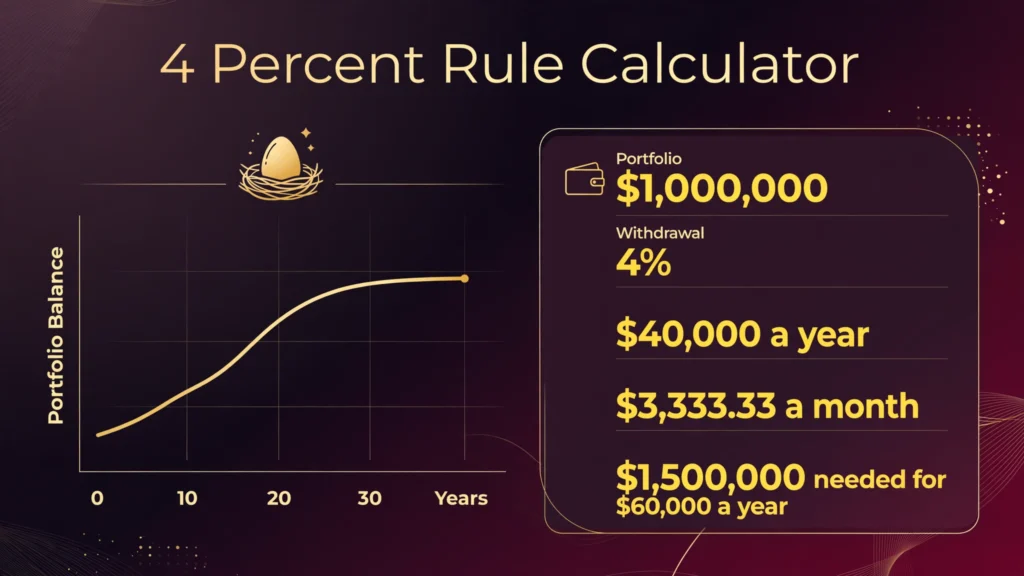
Choose “Safe withdrawal from my portfolio size” when you know what you have saved and want to know what you can take out each year. Enter the portfolio size — the total of the investments the withdrawals will come from, not counting your home. Press the calculate button and three boxes appear: the safe annual withdrawal at 4%, the safe monthly withdrawal, and the withdrawal rate used. A portfolio of $1,000,000 gives $40,000 a year and $3,333.33 a month. The note under the boxes explains the part people most often get wrong: the 4% applies to the first year only. In later years you raise the dollar amount by inflation, and you do not take 4% of the new balance each year.
Choose “Portfolio needed for my target income” when you know what you want to spend and want to know how much you need saved. Enter the annual income you want in retirement, and the tool divides it by 0.04 to give the portfolio needed. An income of $60,000 a year needs a portfolio of $1,500,000. The boxes also show the monthly income that figure supports, which is the annual income divided by 12, and the 4% rate used. Enter only the income your portfolio must cover on its own: if a pension or Social Security will pay part of your spending, subtract that part first and enter the rest. The section on Social Security and pensions below explains why.
Choose “How long my money will last” when you want to test a specific plan rather than the 4% rule itself. Enter the starting portfolio, the annual withdrawal, the assumed annual return, and the annual inflation rate, and tick the box to raise the withdrawal by inflation each year — the box is already ticked, because that is how the 4% rule works. Press calculate and three boxes appear: the number of years until the money runs out, the balance after 10 years, and the balance after 30 years. If the money does not run out within 100 years at your assumptions, the first box says “More than 100 years” instead of a number. The note under the boxes states the simulation’s assumptions plainly: one fixed return every year, the withdrawal taken at the end of each year after that year’s growth, and no market swings. Real markets vary from year to year, and the order of good and bad years changes the result, so treat the simulation as a planning illustration, not a prediction.
If an input is wrong, the tool shows a plain-language error and no results. A portfolio of 0 is rejected because there must be money to withdraw from. A withdrawal of 0 is rejected because a plan with no spending has nothing to test. A return below -10% or above 20% is rejected as outside the range this tool covers, and an inflation rate below 0% or above 10% is rejected the same way. A withdrawal larger than the starting portfolio is allowed: the simulation simply shows the money running out in year 1, which is the correct answer for that plan.
What does a worked example look like?
Start with the first verified test. A portfolio of $1,000,000 at the 4% rule gives a first-year withdrawal of $1,000,000 × 0.04 = $40,000. Divide by 12 for the monthly figure: $40,000 ÷ 12 = $3,333.33 a month. That is the whole forward calculation, and it is the figure most people mean when they quote the rule.
The reverse calculation is the second test. An income target of $60,000 a year needs a portfolio of $60,000 ÷ 0.04 = $1,500,000. That is the 25x rule: 1 divided by 0.04 is 25, so the portfolio needed is 25 times the annual spending. The monthly income that $60,000 a year supports is $60,000 ÷ 12 = $5,000 a month. The same arithmetic works for any target: $45,000 a year needs $45,000 × 25 = $1,125,000, and $30,000 a year needs $30,000 × 25 = $750,000.
The third test shows what the inflation adjustment does to the money over time. Take the $1,000,000 portfolio with a $40,000 first-year withdrawal, an assumed return of 5% a year, and an inflation rate of 3% a year, with the withdrawal raised by inflation each year. In year 1 the balance grows by 5% to $1,050,000, then the $40,000 withdrawal leaves $1,010,000. In year 2 the withdrawal rises to $41,200, so the balance grows to $1,060,500 and the withdrawal leaves $1,019,300. In year 3 the withdrawal is $42,436, and the balance after it is $1,027,829. The balance still grows in the early years, because 5% of $1,000,000 is $50,000 of growth against a $40,000 withdrawal. But the withdrawal keeps rising by 3% a year while the balance grows more slowly, and by year 10 the withdrawal has reached $52,190.93 while the balance stands at $1,058,938.13. By year 20 the withdrawal is $70,140.24 and the balance has fallen to $958,924.76. By year 30 the withdrawal is $94,262.62 and the balance is $532,582.57. The money runs out during year 37. The simulation shows the shape of the problem: a rising withdrawal against a balance that first grows, then flattens, then falls.
The fourth test shows the same plan without the inflation adjustment. A $1,000,000 portfolio, a $40,000 withdrawal every year with no rise, and a 5% return never runs out within 100 years: the balance is $1,010,000 after year 1, $1,125,778.93 after year 10, and $1,664,388.48 after year 30. The difference between the third and fourth tests is the inflation adjustment alone, and it is the difference between money that lasts 37 years and money that never runs out. That is why the inflation box matters more than the return box: a fixed withdrawal is easy to fund, and a rising withdrawal is what tests a portfolio.
A fifth test shows a plan that fails fast. A starting portfolio of $100,000 with a $50,000 annual withdrawal and a 5% return runs out during year 3. After year 1 the balance is $55,000, after year 2 it is $7,750, and in year 3 the 5% growth adds $387.50, leaving $8,137.50 against a $50,000 withdrawal — a shortfall of $41,862.50. The withdrawal is 50% of the portfolio, so no plausible return can save it. The tool reports “3 years”, and the balance boxes show the money ran out before year 10 and before year 30.
A sixth test shows the other extreme, and it is the one that surprises people most. A $500,000 portfolio with a $25,000 annual withdrawal and a 5% return, with no inflation adjustment, never runs out within 100 years. The balance is $500,000 after year 1, and it stays at $500,000 after year 5, because 5% of $500,000 is exactly $25,000: the growth each year is exactly the withdrawal. Add a 3% inflation adjustment to the same plan and it runs out during year 27, with the balance at $458,224.50 after 10 years, $267,665.76 after 20 years, and $77,456.21 after 25 years. The withdrawal starts at 5% of the portfolio and rises from there, so the plan that looked permanent on a fixed withdrawal is gone in 27 years once the withdrawal rises with prices.
What is the 4% rule?
The 4% rule is a retirement withdrawal rule: in the first year of retirement, withdraw 4% of your portfolio, and in every year after that, raise the dollar amount by the inflation rate. A $1,000,000 portfolio gives a first-year withdrawal of $40,000. If inflation is 3% that year, the second year’s withdrawal is $41,200. If inflation is 2% the year after, the third year’s withdrawal is $42,024. The percentage is used once, in year one. After that you follow the dollar amount, not the balance.
The rule works because the portfolio keeps growing while you withdraw from it. A $1,000,000 portfolio earning 5% a year grows by $50,000 in the first year, which is more than the $40,000 withdrawn. The balance after year one is $1,010,000 before the next year’s growth. The rule only fails when the withdrawals, growing by inflation each year, outpace the growth for long enough — and the historical evidence says that at 4% this takes longer than 30 years in about 95% of cases.
The rule is not a law of nature. It is a summary of what happened in the past, on US market data, for a particular portfolio mix, over 30-year retirements. The top results for this keyword agree that the rule has held up well in practice, and they also agree that it is a starting point for planning rather than a promise. The rest of this article explains where the number comes from, what it assumes, and where it breaks.
The rule is about the first year only. It does not say to take 4% of the balance every year, and it does not say the portfolio will last forever. It says that a withdrawal of 4% of the starting balance, raised by inflation each year, had a high chance of lasting 30 years in the historical data. The longevity mode of this calculator lets you test the same idea at other returns and other inflation rates, so you can see for yourself how sensitive the answer is to the assumptions.
Where did the 4% rule come from?
The rule comes from William Bengen, a financial planner who published a paper called “Determining Withdrawal Rates Using Historical Data” in the Journal of Financial Planning in October 1994. Bengen took actual US stock and bond market data going back to 1926 and asked a plain question: what is the highest withdrawal rate a retiree could have used, in the worst historical starting year, and still not run out of money over 30 years? He tested a portfolio of 50% large-company stocks and 50% intermediate-term government bonds, rebalanced each year, and withdrawal rates from 3% up to 10%. His answer was 4.15%, which he rounded down to 4% for the published rule. The worst starting year in his data was 1966, when a retiree walked straight into a decade of weak stock returns and high inflation — and even that retiree’s money lasted at least 33 years at a 4% withdrawal rate. Bengen later revised his own figure upward, to about 4.5% in 2006 after adding small-company stocks to the portfolio, and to a 4.7% “Universal SAFEMAX” in his 2025 book A Richer Retirement, after widening the portfolio to seven asset classes including international shares. He has been clear that these are worst-case floors from history, not targets to aim at.
The rule was tested again by three professors at Trinity University in Texas, in a paper published in the February 1998 edition of the AAII Journal. Their study — now known as the Trinity Study — tested withdrawal rates from 3% to 12% over retirement periods of 15 to 30 years, using a portfolio of S&P 500 stocks and long-term corporate bonds. Their result matched Bengen’s: a 4% withdrawal rate, adjusted for inflation, survived about 95% of the 30-year periods tested, and a 3% rate survived 100%. The agreement between two studies with different data and different methods is why the 4% figure is treated as a finding rather than a guess.
The rule’s 4% is the worst case, not the average case. The average retirement in the historical data could have supported a withdrawal rate well above 4% — Bengen’s average “SAFEMAX” across all starting years was about 7% — but the rule is set by the retirees who retired at the worst moments. That is the point of the rule: it is designed to survive the bad years, not to describe the good ones. A retiree who plans at 4% and retires into a good period will have money left over; a retiree who plans at 7% and retires into a bad period will not.
How does the 4% rule maths work?
The forward maths is a single multiplication. Annual withdrawal = portfolio × 0.04. A $750,000 portfolio gives $750,000 × 0.04 = $30,000 a year. A $2,000,000 portfolio gives $2,000,000 × 0.04 = $80,000 a year. The monthly withdrawal is the annual figure divided by 12: $30,000 a year is $2,500 a month, and $80,000 a year is $6,666.67 a month. There is no compounding in this step and no growth assumption — the 4% is applied to the starting balance once.
The reverse maths is a single division. Portfolio needed = annual income ÷ 0.04. An income of $60,000 a year needs $60,000 ÷ 0.04 = $1,500,000. An income of $45,000 a year needs $1,125,000, and an income of $100,000 a year needs $2,500,000. The reverse calculation is the same as multiplying the income by 25, because 1 ÷ 0.04 = 25. The “25 times your spending” figure quoted in retirement planning is the same rule written the other way round.
The longevity maths is a year-by-year simulation, and it is the only part of the tool that needs one. Each year, the balance grows by the return, and then the withdrawal is taken out. In the first year of a $1,000,000 portfolio at a 5% return with a $40,000 withdrawal, the balance becomes $1,000,000 × 1.05 = $1,050,000, then the withdrawal leaves $1,010,000. In the second year the balance becomes $1,010,000 × 1.05 = $1,060,500, and the withdrawal, raised by 3% inflation, is $41,200, leaving $1,019,300. The simulation repeats that step until the balance falls to zero or 100 years pass. The tool reports the year the balance reaches zero, the balance after 10 years and the balance after 30 years.
The simulation assumes the return is the same every year, which is a simplification. Real returns vary, and the order of good and bad years changes the answer — the sequence-of-returns risk described below. The simulation also assumes the withdrawal is taken at the end of each year, after that year’s growth, which is the convention the tool uses throughout. A present value of money calculator can show what the same figures are worth in today’s money, because $40,000 in 30 years buys much less than $40,000 today.
Why is the withdrawal adjusted for inflation each year?
Inflation is the slow rise in prices, and it is what makes a fixed dollar amount buy less each year. A $40,000 withdrawal buys $40,000 worth of goods in year 1. At 3% inflation a year, the same goods cost $41,200 in year 2 and $52,190.93 in year 10. If the withdrawal stayed at $40,000, the retiree’s spending power would fall every year, and by year 30 the $40,000 would buy roughly what $16,480 buys today. The inflation adjustment exists to hold spending power steady, so the retiree lives the same way in year 20 as in year 1.
The adjustment is the part of the rule that makes it hard to follow. The retiree must raise the withdrawal every year, even in a year when the portfolio has fallen. In a year when the portfolio falls 20% and inflation is 3%, the withdrawal still rises by 3%, and the withdrawal as a share of the reduced balance rises sharply. The rule’s history says that following the adjustment through those years is what made the money last — the retirements that failed were the ones that started at the worst moments, not the ones that followed the rule most strictly.
The tool’s longevity mode has the inflation box ticked by default, because that is how the rule works. Untick it to see the difference: the same plan that runs out in year 37 at 3% inflation never runs out within 100 years without the adjustment. The difference is not a rounding effect. It is the whole cost of holding spending power steady for 30 years, and it is the reason the 4% figure is 4% rather than a higher number.
Why 4% and not 5% or 3%?
The answer comes from the Trinity Study’s success rates. At 3%, the portfolio survived virtually every historical 30-year period tested. At 4%, it survived about 95% of them. At 5%, it survived roughly 80%. Each extra percentage point of withdrawal buys more spending and costs a larger chance of running out. The 4% figure sits at the point where the cost starts to rise steeply: moving from 4% to 5% costs about 15 percentage points of success, while moving from 3% to 4% costs about 5. Bengen’s own work points the same way: his worst-case safe rate was 4.15%, so 4% was the rounded-down figure that survived even the worst starting year in his data, while 4.25% would have run one historical portfolio dry in 28 years.
The same comparison at 3.5% shows why some planners prefer it. A 3.5% withdrawal rate on a $1,000,000 portfolio gives $35,000 a year, or $2,916.67 a month, and $40,000 a year of spending needs $40,000 ÷ 0.035 = $1,142,857.14 saved. The Trinity data puts 3.5% between the near-certain 3% and the 95% of 4%, and Morningstar’s 2026 research puts the forward-looking safe rate at 3.9% — close to 4%, but not above it. The difference between 3.5% and 4% is $5,000 a year on a $1,000,000 portfolio, which is the price of the extra safety.
A higher rate is not wrong in itself; it is a trade. At 5%, the same $1,000,000 gives $50,000 a year, or $4,166.67 a month, and $60,000 a year of spending needs only $1,200,000 saved instead of $1,500,000. The trade is that roughly 1 in 5 historical retirements at 5% ran out of money within 30 years, against about 1 in 20 at 4%. The 4% rule exists because most people would rather save more than accept that chance — and because the retirements that failed at 5% started in the late 1960s, when markets fell and inflation rose, which is exactly the combination that the rule is built to survive.
What is sequence-of-returns risk?
Sequence-of-returns risk is the risk that bad market years arrive early in retirement, when the portfolio is largest and the withdrawals are taking money out at the worst moment. Two retirees can earn the same average return over 30 years and end up with very different outcomes, because the order of the yearly returns matters. A portfolio that falls 30% in the first year of retirement turns a 4% withdrawal into a 5.7% withdrawal from the reduced balance, and the money taken out in that first year can never grow back. The same 30% fall in year 25, when most of the spending is already done, barely matters.
The 4% rule exists because of this risk. Bengen’s and the Trinity Study’s worst cases were retirements that started just before long stretches of poor returns and high inflation — 1966 in Bengen’s data, and the late 1960s in the Trinity data. The 4% rate is the rate that survived those sequences. A retiree who plans at a higher rate is betting that their retirement will not start with one of those sequences, and the bet is made once, on the first day, with no way to change it after the fact.
The longevity simulation in this tool does not model sequence-of-returns risk, because it applies one fixed return every year. A plan that never runs out at a steady 5% return can still fail if the real returns are 5% on average but arrive in the wrong order. The simulation is useful for comparing plans and for seeing the effect of the inflation adjustment, and it is not a substitute for testing a plan against varied return sequences. A retiree who wants to test that risk needs a tool that runs many random sequences and reports how often the money lasts, which is a different calculation from the one this tool performs.
When does the 4% rule not apply?
The rule was tested on 30-year retirements, so it does not directly apply to a retirement that must last 40 or 50 years. Someone retiring at 40 needs the money to last twice as long as the tested horizon, and the historical evidence for that span is thinner. The top results for this keyword agree that early retirees should use a lower rate — commonly 3.25% to 3.5% — because the failure rate of a fixed 4% rule climbs over longer horizons. At 3.5%, a $1,000,000 portfolio gives $35,000 a year, or $2,916.67 a month, and $40,000 a year of spending needs $40,000 ÷ 0.035 = $1,142,857.14 saved.
The rule does not apply when the retiree cannot keep to it. The rule assumes the withdrawal rises by inflation every year, even after a market fall, and it assumes the retiree does not take extra money out for a large purchase. A retiree who withdraws an extra $100,000 for a house deposit in year 5 has broken the rule’s assumptions, and the 4% figure no longer describes their plan. The rule is a plan for a fixed, regular withdrawal, and it says nothing about irregular spending on top.
The rule does not apply to a portfolio that is very different from the one tested. Bengen’s portfolio was 50% large-company stocks and 50% intermediate-term government bonds, and the Trinity Study’s portfolios were S&P 500 stocks and long-term corporate bonds, in mixes from 0% stocks to 100% stocks. A portfolio held entirely in cash, or entirely in a single stock, behaves differently from those mixes, and the 4% figure was not tested on it. The rule also says nothing about other countries’ markets: it was tested on US data, and a retiree in another country with a different market history is working from a different set of evidence.
The rule does not apply when the retiree has large guaranteed income, because the calculation changes. The rule is applied to the spending the portfolio must cover, after Social Security and pensions are subtracted — which is the subject of the next section but one. A retiree whose Social Security covers all their spending does not need the 4% rule at all, and a retiree whose pension covers half their spending applies the rule only to the other half. The rule is a tool for the portfolio’s share of the spending, not for the whole of it.
What are the alternatives to the 4% rule?
The most widely discussed alternative is a guardrails approach, where the withdrawal rate is allowed to move within a band. The retiree starts at a chosen rate, often near 4%, and raises or cuts spending when the portfolio moves outside set limits — spending more when the portfolio has grown well above its starting value, and cutting back when it has fallen. The idea is to adapt to what actually happens instead of following a fixed dollar amount set on the first day. It needs more attention than the 4% rule, because the retiree must check the portfolio each year and accept a cut when the rules say so.
A simpler alternative is to withdraw a fixed percentage of the current balance each year, rather than a fixed dollar amount. The money can never run out, because the withdrawal shrinks as the balance shrinks, but the income varies from year to year and can fall sharply after a bad year. A $1,000,000 portfolio at 4% of the current balance gives $40,000 in year one, but if the balance falls to $700,000 the withdrawal falls to $28,000, and the retiree must live on less. The 4% rule’s fixed dollar amount exists precisely to avoid that variation, and the cost of the fixed amount is the risk of running out.
Another alternative is a bucket strategy, where the retiree holds one or two years of spending in cash, several years in bonds, and the rest in shares. Withdrawals come from the cash bucket, which is refilled from the bonds when markets are good and left alone when markets are bad. The idea is to avoid selling shares in a down year. It is a way of managing the same sequence-of-returns risk, and it works by the same principle: the shares are left to recover, and the spending comes from the safer buckets in the meantime.
The final alternative is to buy guaranteed income — an annuity — with part of the portfolio, so that the spending it covers is no longer at the mercy of the market. The annuity pays a fixed income for life, and the remaining portfolio only has to cover the spending above that income. The cost is that the money used to buy the annuity is gone: it cannot be left to heirs, and it cannot be spent on anything else. The 4% rule is the do-it-yourself version of the same idea, and the choice between them is a choice between keeping control of the money and giving up control in exchange for certainty.
How long will my money last?
The answer depends on the return and on whether the withdrawal rises with inflation, and the table below shows both effects for the standard case: a $1,000,000 portfolio with a $40,000 first-year withdrawal. Every figure in this table was computed with the same yearly simulation the tool uses — one fixed return each year, the withdrawal taken at the end of the year after that year’s growth, and the withdrawal raised by 3% a year where the table says so. “Never” means the money does not run out within 100 years at those assumptions.
| Annual return | No inflation adjustment | 3% inflation adjustment |
|---|---|---|
| 3% | 47 years | 26 years |
| 4% | Never (100+ years) | 30 years |
| 5% | Never (100+ years) | 37 years |
| 6% | Never (100+ years) | 49 years |
| 7% | Never (100+ years) | Never (100+ years) |
Two patterns in the table are worth reading. First, without the inflation adjustment, a return of 4% or more covers a $40,000 withdrawal from $1,000,000 forever, because 4% of $1,000,000 is exactly $40,000: the growth each year pays the withdrawal and the balance never falls. At a 3% return the growth is $30,000 a year against a $40,000 withdrawal, so the balance falls by $10,000 a year at first and runs out in 47 years. Second, with a 3% inflation adjustment, even a 6% return only stretches the money to 49 years, because the withdrawal rises every year while the return applies to a shrinking balance. The inflation adjustment, not the return, is what ends most plans in this table — and it is the part of the 4% rule that the simple “$40,000 a year” headline leaves out.
The same table for a smaller portfolio tells the same story at a different scale. A $500,000 portfolio with a $20,000 first-year withdrawal at a 5% return never runs out within 100 years with no inflation adjustment, and runs out in 37 years with a 3% inflation adjustment — the same 37 years as the $1,000,000 case, because the withdrawal is the same 4% of the starting balance and the return and inflation are the same. The years until the money runs out depend on the rates, not on the size of the portfolio, as long as the withdrawal is the same share of it. That is why the 4% rule can be stated as a percentage at all: the percentage is what matters, and the dollars follow from it.
How do Social Security and a pension change the number?
Social Security and a pension change the number before the 4% rule is ever applied, because the rule only has to cover the spending the portfolio must pay for. The method is a subtraction: work out the annual spending first, then subtract the annual income from Social Security and any pension, and apply the 4% rule to what is left. Someone who wants to spend $60,000 a year and receives $24,000 a year from Social Security needs the portfolio to cover $36,000 a year, which needs $36,000 × 25 = $900,000 saved — not the $1,500,000 the full $60,000 would need. The $600,000 difference is the value of the guaranteed income, and it is the largest single reduction most retirees can make to their savings target.
The same subtraction works the other way round, for a portfolio that is already fixed. A retiree with $1,000,000 saved, who receives $24,000 a year from Social Security and wants to spend $60,000 a year, needs the portfolio to cover $36,000 a year. At 4%, a $1,000,000 portfolio gives $40,000 a year, which is more than the $36,000 needed — so the plan works, with $4,000 a year of headroom. Without the Social Security income the same portfolio would fall $20,000 a year short of the $60,000 target, and the retiree would need to save more or spend less.
The subtraction must use the same year’s figures. Social Security income rises with inflation, so a $24,000 benefit today is worth more in ten years’ time, and the spending figure should be in the same year’s dollars. The tool’s calculator does not ask for Social Security income: the subtraction is done before the numbers are entered, by entering only the income the portfolio must cover. A retiree who enters the full $60,000 as the target income, without subtracting the $24,000, will get the $1,500,000 figure — and will have saved $600,000 more than the plan needs.
What mistakes do people commonly make with the 4% rule?
The first mistake is treating 4% as a guarantee. The Trinity Study found about a 95% success rate over 30 years, which means about 1 in 20 historical retirements at 4% ran out of money. A 95% success rate is a good result for a rule of thumb, and it is not a promise. The retirements that failed started in the late 1960s, when markets fell and inflation rose in the first years — the sequence-of-returns risk described above — and the next failure, if one comes, will look different from the last one.
The second mistake is applying the 4% to the balance every year instead of only in the first year. A retiree who takes 4% of the current balance each year is not following the 4% rule: their income falls when the portfolio falls, and rises when it rises, and the withdrawal rate is no longer 4% of the starting balance. The rule fixes the dollar amount in year one and raises it by inflation; it never re-applies the percentage to the balance. A retiree who wants a percentage-of-balance withdrawal should plan for it explicitly, and accept the income variation that comes with it.
The third mistake is forgetting the inflation adjustment. A $40,000 withdrawal that never rises buys less every year, and by year 30 it buys roughly what $16,480 buys today at 3% inflation. A retiree who plans at $40,000 a year without the adjustment is planning for a falling standard of living, and may not notice it until the spending power has already dropped by a third. The inflation adjustment is not optional: it is the part of the rule that makes the 4% figure work, and leaving it out changes the answer completely, as the longevity table above shows.
The fourth mistake is ignoring fees and taxes. The historical studies used returns before fees and before tax, and a retiree paying 1% a year in fees and tax on withdrawals is working with a lower net return than the studies assumed. A 1% fee on a $1,000,000 portfolio is $10,000 a year, which is a quarter of the $40,000 withdrawal. The fee comes out of the portfolio before the withdrawal, so the effective withdrawal rate is higher than 4% — and the success rate is lower than the studies’ 95%. Fees and taxes must be allowed for before the 4% rule is applied, by reducing the portfolio or the return entered into the tool.
The fifth mistake is treating the rule as a licence to spend the maximum. The 4% figure is the worst-case safe rate, and a retiree who can live on less than 4% has more safety. A retiree who withdraws 3% instead of 4% needs a larger portfolio for the same income — $1,333,333.33 for $40,000 a year instead of $1,000,000 — but the money is far more likely to last, and there is more left over at the end. The rule is a ceiling, not a target, and the retirements that failed at 4% are a reminder that the ceiling is not far above the safe rate.
The sixth mistake is applying the rule to a retirement much longer than 30 years without adjusting it. A person retiring at 40 needs the money to last 50 years or more, and the 4% rate was not tested on that horizon. The top results for this keyword agree that a lower rate — commonly 3.25% to 3.5% — is the right figure for a 50-year retirement, and that the failure rate of a fixed 4% rule climbs over longer horizons. The longevity mode of this calculator can show the difference: a plan that never runs out at a 5% return with no inflation adjustment can still run out in 37 years with a 3% inflation adjustment, and the longer the horizon, the more the inflation adjustment matters.
The seventh mistake is checking the portfolio once and never looking again. The 4% rule is a plan made on the first day of retirement, and it assumes the retiree follows it for 30 years. A retiree who retires into a market fall and keeps withdrawing the inflation-adjusted amount, without ever checking whether the plan still works, may find the money running out sooner than the rule suggested. The rule is a starting point, and the retiree should check the plan each year — the guardrails approach described above is one way of doing that, and a simple annual check of the balance against the original plan is another.
What are the limits of this calculator?
This calculator models the 4% rule and a simple yearly simulation, and it leaves out the things that make real retirements harder to predict. The longevity simulation applies one fixed return every year, so it cannot show sequence-of-returns risk: a bad run of markets early in retirement can end a plan that survives at a steady return, and a good run early can save a plan that fails at a steady return. It does not model fees, taxes, or health care costs, and it does not model Social Security or pension income — those are handled by the subtraction described above, before the numbers are entered.
The calculator also assumes the portfolio is the only source of income, and that the withdrawal is the only thing taken out of it. It does not model a mortgage or other debts, and it does not model the sale of a home or any other asset. A retiree who plans to pay off a mortgage in retirement, or to sell a home and downsize, is working with a different set of numbers, and the tool’s figures do not allow for those changes. The tool is a planning illustration for a simple, steady plan, not a full retirement plan.
The 4% rule itself carries the limits of its origin. It was tested on US market history from 1926 onward, on a balanced stock and bond portfolio, over 30-year retirements, and it says nothing about other countries’ markets, other portfolio mixes, or retirements longer than 30 years. It also assumes the retiree follows the rule exactly, raising the withdrawal by inflation every year regardless of what the market did — behaviour that many retirees find hard to keep up after a market fall. The rate calculator can show what return a different withdrawal rate would need, if you want to test a rate other than 4%.
How can I check the tool against a known result?
The simplest check uses the first verified test. Choose “Safe withdrawal from my portfolio size”, enter a portfolio of $1,000,000, and press calculate. The tool should show a safe annual withdrawal of $40,000.00, a safe monthly withdrawal of $3,333.33, and a withdrawal rate of 4%. Every box should match. If any box differs, an entered value differs from the test, and the error is in the input rather than in the tool.
Run the second verified test the same way. Choose “Portfolio needed for my target income”, enter an annual income of $60,000, and press calculate. The tool should show a portfolio needed of $1,500,000.00 and a monthly income of $5,000.00. The two modes are the same calculation in opposite directions, so the figures should be consistent with each other: $40,000 a year from $1,000,000 is the same as $1,000,000 needed for $40,000 a year.
Run the longevity test next. Choose “How long my money will last”, enter a portfolio of $1,000,000, a withdrawal of $40,000 a year, a return of 5% a year and inflation of 3% a year, with the inflation box ticked, and press calculate. The tool should say the money runs out in year 37, with a balance after 10 years of $1,058,938.13 and a balance after 30 years of $532,582.57. Untick the inflation box and press calculate again: the first box should change to “More than 100 years”, and the balance after 10 years should rise to $1,095,512.62. If either figure differs, an entered value differs from the test.
Check the error cases as well. Enter a portfolio of 0 in the safe withdrawal mode and press calculate: the tool should show a plain-language error and no results. Enter a return of 25% in the longevity mode and press calculate: the tool should reject it as outside the range this tool covers, because the tool only accepts returns from -10% to 20%. A tool that shows a result for a rejected input, or shows no error for a 0 portfolio, is not behaving as described.
The rule itself can be checked against the sources. PlanMyFire’s account of the 4% rule works through the same $1,000,000 example and the same 4% figure, and it explains the rule’s origin in Bengen’s 1994 paper and the Trinity Study. The Fire Pathway’s review of whether the rule is still safe covers the same research, including Bengen’s later revisions and Morningstar’s 2026 figure. PlanBend’s 2026 comparison sets the 4% rule against the guardrails approach and other alternatives, and it quotes the same success rates.
The figures can also be checked against a tool that does not use the 4% rule at all. The Money Pocket’s withdrawal calculator runs the same kind of year-by-year simulation with its own inputs, and it should give the same answer for the same inputs: a $1,000,000 portfolio, a $40,000 withdrawal, a 5% return and 3% inflation should run out in the same year on both tools. The worked examples and the longevity table on this page are the fastest check of all, and they are the figures to compare first. More tools like this one are in the calculators category.
How much can I withdraw at common rates?
Every figure in this table was computed from the same formula the tool uses: annual withdrawal = portfolio × rate, and monthly withdrawal = annual withdrawal ÷ 12. The 4% column is the 4% rule itself; the 3% and 3.5% columns are the more cautious rates often suggested for early retirees, and the 5% column shows the more generous rate whose success rate falls to roughly 80% in the Trinity data. For a different portfolio size, scale the figures: the withdrawal on $2,500,000 is two and a half times the withdrawal on $1,000,000 at the same rate, because the formula multiplies the portfolio by the same rate.
| Portfolio | 3% a year | 3.5% a year | 4% a year | 4% a month | 5% a year |
|---|---|---|---|---|---|
| $250,000.00 | $7,500.00 | $8,750.00 | $10,000.00 | $833.33 | $12,500.00 |
| $500,000.00 | $15,000.00 | $17,500.00 | $20,000.00 | $1,666.67 | $25,000.00 |
| $750,000.00 | $22,500.00 | $26,250.00 | $30,000.00 | $2,500.00 | $37,500.00 |
| $1,000,000.00 | $30,000.00 | $35,000.00 | $40,000.00 | $3,333.33 | $50,000.00 |
| $1,500,000.00 | $45,000.00 | $52,500.00 | $60,000.00 | $5,000.00 | $75,000.00 |
| $2,000,000.00 | $60,000.00 | $70,000.00 | $80,000.00 | $6,666.67 | $100,000.00 |
Two patterns in the table are worth reading. First, each extra half percentage point of rate adds $5,000 a year on a $1,000,000 portfolio — $2,500 a year on $500,000 and $10,000 a year on $2,000,000 — so the reward for a higher rate grows with the size of the portfolio. Second, the gap between the cautious 3% rate and the generous 5% rate is $20,000 a year on a $1,000,000 portfolio, which is the difference between $2,500 a month and $4,166.67 a month of spending. That gap is the whole argument in one table: more spending now, or more certainty that the money lasts.
Frequently asked questions
What is the 4 percent rule?
The 4 percent rule says you can withdraw 4% of your portfolio in the first year of retirement, then raise that dollar amount by inflation each year, with a high chance of the money lasting 30 years. A $1,000,000 portfolio gives a first-year withdrawal of $40,000, or $3,333.33 a month. It comes from William Bengen’s 1994 research and the 1998 Trinity Study, and it is a planning rule of thumb, not a guarantee.
How much do I need to retire using the 4 percent rule?
Multiply your annual spending by 25. If you want to spend $60,000 a year, you need $1,500,000 saved. If you want to spend $40,000 a year, you need $1,000,000. Subtract any Social Security or pension income from your spending first, and multiply only the amount your portfolio must cover.
Is the 4 percent rule still safe?
For a traditional 30-year retirement, the research behind it has held up reasonably well: the Trinity Study found about a 95% success rate over 30 years, and the 2011 update covering the 2008 crisis kept that result. But current research disagrees about the exact rate — Bengen himself now puts the worst-case safe rate at 4.7% with a more diversified portfolio, while Morningstar’s 2026 research puts it at 3.9% on forward-looking assumptions. The rule is a starting point, not a guarantee, and it was never tested on retirements longer than 30 years.
How long will my money last at a 4 percent withdrawal rate?
It depends on the return you earn and on inflation. With a $1,000,000 portfolio, a $40,000 first-year withdrawal, a 5% return and a 3% inflation adjustment, the money runs out during year 37. Without the inflation adjustment, the same plan never runs out within 100 years, because 5% growth covers the $40,000 withdrawal. Use the longevity mode of this calculator with your own return and inflation figures to test your plan.
Does the 4 percent rule include Social Security?
No. The rule assumes the portfolio is your only source of income. If you receive Social Security or a pension, subtract that annual income from your spending first, and apply the 4% rule only to the amount left. Someone who wants to spend $60,000 a year and receives $24,000 a year from Social Security needs the portfolio to cover $36,000 a year, which needs $900,000 saved instead of $1,500,000.
What is sequence-of-returns risk?
It is the risk that bad market years arrive early in retirement, when the portfolio is largest and withdrawals are taking money out at the worst moment. Two retirees can earn the same average return over 30 years and end up with very different outcomes, because the order of the yearly returns matters. A 30% fall in the first year turns a 4% withdrawal into a 5.7% withdrawal from the reduced balance, and the money taken out then can never grow back. The 4% rule exists because of this risk — it is the rate that survived the worst historical sequences — and the longevity simulation in this tool does not model it, because it applies one fixed return every year.