Home Loan Affordability Calculator
Enter your gross monthly income, your other monthly debts, your down payment, the interest rate and the loan term. The tool works out the largest monthly housing payment the 28/36 guideposts allow, the largest loan that payment supports, and the highest home price that loan plus your down payment reaches.
This is an estimate based on the commonly cited 28/36 guideposts. Lenders use their own rules and also weigh your credit, employment and other factors, so the result is not a pre-approval. The figures are for general information only.
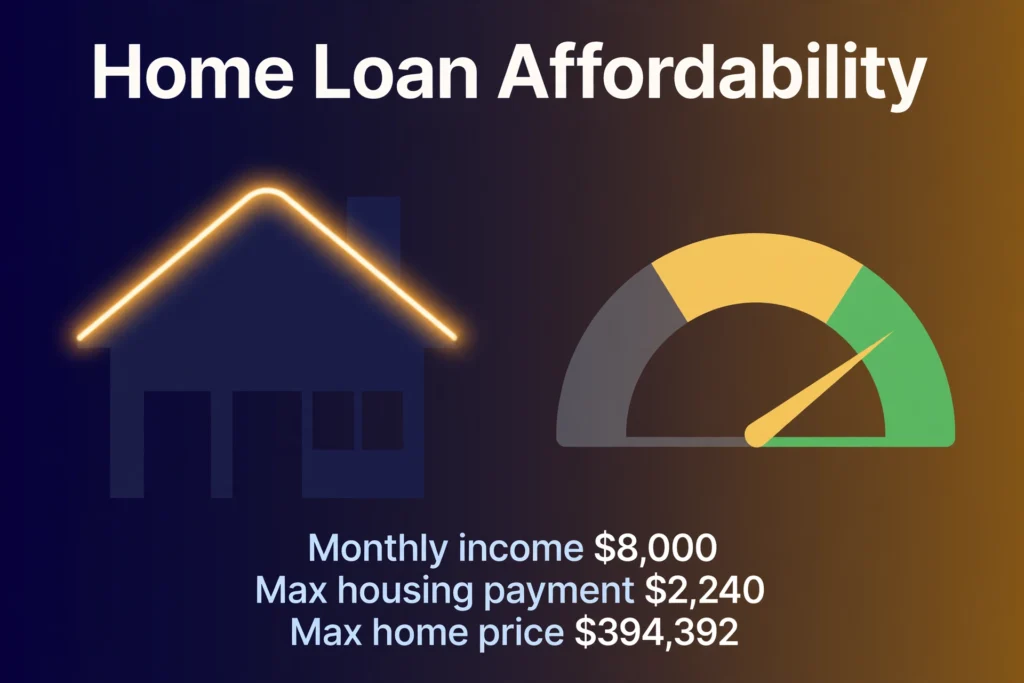
How much home loan you can qualify for depends on your gross monthly income, your other monthly debts, your down payment, the interest rate and the loan term. As a rough guide, lenders often use the 28/36 rule: no more than 28% of your gross monthly income on housing, and no more than 36% on all debts together. On a gross monthly income of $8,000 with $500 of other debts, that gives a maximum housing payment of $2,240 a month, which at 6.5% over 30 years supports a loan of $354,392.24 and, with a $40,000 down payment, a home price of $394,392.24.
How do I use the Home Loan Affordability Calculator?
Enter your gross monthly income first. That is your income before tax and other deductions are taken out, not the amount that lands in your bank account. If you are paid a salary, divide your annual salary by 12. If you are paid hourly, multiply your hourly rate by your typical weekly hours, multiply that by 52, and divide by 12. If you are paid every two weeks, multiply one gross paycheck by 26 and divide by 12.
Enter your other monthly debts next. That is every recurring monthly debt payment except the mortgage itself: a car loan, a student loan, minimum payments on credit cards, a personal loan, and court-ordered payments such as child support or alimony. Use the minimum payment for credit cards, not the balance. Leave the field at 0 if you have no other debts.
Enter your down payment, the annual interest rate, and the loan term. The down payment is already filled in as 0, so enter the amount you have saved, or leave it at 0 to see the loan figure on its own. The rate is entered as a percentage, for example 6.5 for 6.5% a year. The term is already filled in as 30 years, which is the most common term, but change it to 15 if that is the term you are considering.
The last two boxes hold the front-end and back-end limits, already filled in as 28 and 36, which are the commonly cited guideposts. Change them only if you want to test a different set of limits, for example 31 and 43, which are the benchmarks often cited for FHA loans. Press the calculate button and five labelled boxes appear. The first box is the maximum monthly housing payment under the front-end limit. The second box is the maximum total debt payment under the back-end limit. The third box is the binding monthly payment, which is the smaller of the front-end maximum and the back-end room left after your other debts. The fourth box is the maximum loan amount that binding payment supports. The fifth box is the maximum home price, which is the maximum loan plus your down payment. Under the boxes, a note says which limit binds and shows the two figures it was chosen from.
If an input is wrong, the tool shows a plain-language error and no results. An income of 0 is rejected because a ratio with no income has no meaning. A negative figure in any debt or down payment field is rejected because a payment cannot be below 0. A rate above 30% is rejected because it sits outside the range this tool is built for. A term of 0 years or 41 years is rejected because the term must be a whole number of years from 1 to 40. A term of 30.5 years is rejected for the same reason, because the term must be a whole number. A front-end or back-end limit of 0 or above 100 is rejected because a limit must sit between 1% and 100%. If your other debts already use up the whole back-end limit, the tool says so plainly and shows no results, because no room is left for a housing payment at all.
What does a worked example look like?
Start with the first verified test. A borrower earns $8,000 a month before tax, pays $500 a month in other debts, has a $40,000 down payment, and is looking at a rate of 6.5% over 30 years. The front-end maximum is 28% of $8,000, which is $2,240.00 a month. The back-end maximum is 36% of $8,000, which is $2,880.00 a month for all debts together, so the room left for housing after the $500 of other debts is $2,880.00 minus $500, which is $2,380.00. The binding payment is the smaller of $2,240.00 and $2,380.00, so it is $2,240.00, and the front-end limit binds. That payment, at 6.5% over 30 years, supports a maximum loan of $354,392.24. Add the $40,000 down payment and the maximum home price is $394,392.24. At the binding payment, the back-end ratio is ($2,240.00 plus $500) divided by $8,000, which is 34.25%, inside the 36% guidepost. The loan is 3.69 times the annual income of $96,000, which is higher than the rough 2.5-times-income rule of thumb some guides quote, and the gap shows why a payment-based calculation is worth doing instead of trusting a multiple.
A second test uses a smaller income and a higher rate. A borrower earns $5,000 a month, pays $200 a month in other debts, has a $20,000 down payment, and is looking at 7% over 30 years. The front-end maximum is 28% of $5,000, which is $1,400.00. The back-end maximum is 36% of $5,000, which is $1,800.00, so the room left for housing is $1,800.00 minus $200, which is $1,600.00. The binding payment is $1,400.00, and the front-end limit binds again. That payment supports a maximum loan of $210,430.60, and with the $20,000 down payment the maximum home price is $230,430.60.
A third test shows the back-end limit binding instead. A borrower earns $12,000 a month, pays $1,500 a month in other debts, has a $100,000 down payment, and is looking at 6% over 15 years. The front-end maximum is 28% of $12,000, which is $3,360.00. The back-end maximum is 36% of $12,000, which is $4,320.00, so the room left for housing is $4,320.00 minus $1,500, which is $2,820.00. The binding payment is $2,820.00, and the back-end limit binds. That payment, at 6% over 15 years, supports a maximum loan of $334,179.91, and with the $100,000 down payment the maximum home price is $434,179.91. The same borrower with no other debts would have a binding payment of $3,360.00, a maximum loan of $398,171.81 and a maximum home price of $498,171.81, so the $1,500 a month of other debts costs $63,991.90 of loan and the same amount of home price.
A fourth test shows the back-end limit binding hard. A borrower earns $6,000 a month, pays $1,200 a month in other debts, has a $30,000 down payment, and is looking at 6.5% over 30 years. The front-end maximum is 28% of $6,000, which is $1,680.00. The back-end maximum is 36% of $6,000, which is $2,160.00, so the room left for housing is $2,160.00 minus $1,200, which is $960.00. The binding payment is $960.00, and the back-end limit binds by a wide margin. That payment supports a maximum loan of $151,882.39, and with the $30,000 down payment the maximum home price is $181,882.39. The same borrower with no other debts would have a binding payment of $1,680.00, a maximum loan of $265,794.18 and a maximum home price of $295,794.18. With $600 a month of other debts instead of $1,200, the binding payment would be $1,560.00, the maximum loan $246,808.88 and the maximum home price $276,808.88. At 6.5% over 30 years, each $100 a month of other debt cuts the maximum loan by $15,821.08, which is why paying down a car loan or a card balance before applying can move the result more than a small pay rise does.
What is the 28/36 rule?
The 28/36 rule is a long-used guideline for home affordability, not a law and not a lending rule. It has two parts, both measured against gross monthly income, which is income before tax and other deductions are taken out. The 28% part, called the front-end ratio or housing ratio, says the total monthly housing payment should not exceed 28% of gross monthly income. The 36% part, called the back-end ratio or total debt-to-income ratio, says the housing payment plus every other monthly debt payment should not exceed 36% of gross monthly income.
The two numbers do different jobs. The 28% number asks whether the housing cost alone fits the income. The 36% number asks whether all debts together fit the income. A borrower can pass one and fail the other, and the calculator shows both so the tighter one can be seen. In the first verified test, the front-end figure of $2,240.00 is tighter than the back-end room of $2,380.00, so the front-end limit binds. In the fourth test, the back-end room of $960.00 is far tighter than the front-end figure of $1,680.00, so the back-end limit binds.
The rule is a comfort benchmark as much as a lender benchmark. A borrower who stays inside both numbers has room in the budget for the expenses the ratios ignore, such as utilities, groceries, transport and saving. A borrower who goes past them may still be approved, because lenders approve loans well above a 36% back-end ratio when the rest of the application supports it, but the budget gets tighter, and the borrower feels it every month. The Consumer Financial Protection Bureau’s own budgeting suggestions echo the same two figures for homeowners: housing at 28% or less, and all debts at 36% or less. Those are suggestions for household budgeting, not limits a lender applies, and this page quotes them as suggestions.
What is the difference between the front-end and back-end limits?
The front-end limit counts only the housing payment against gross monthly income. The back-end limit counts every monthly debt payment, housing included, against the same income. The front-end ratio is always equal to or smaller than the back-end ratio for the same housing payment, because the back-end numerator contains the front-end numerator plus every other debt. That is why the tool needs both: the front-end figure caps the housing payment on its own, and the back-end figure caps it again once the other debts are counted.
Which limit binds depends on how much other debt the borrower carries. With no other debts, the back-end room is always larger than the front-end maximum, because 36% of any income is larger than 28% of the same income, so the front-end limit always binds. As other debts grow, the back-end room shrinks by exactly the amount of those debts, while the front-end maximum stays still. The two cross when the other debts reach 8% of gross monthly income, which is the gap between 36% and 28%. In the first test, other debts of $500 are 6.25% of the $8,000 income, below that 8% line, so the front-end limit binds. In the third test, other debts of $1,500 are 12.50% of the $12,000 income, above the line, so the back-end limit binds. In the fourth test, other debts of $1,200 are 20.00% of the $6,000 income, well above the line, so the back-end limit binds by a wide margin.
The two limits can be changed in the tool, and changing them shows how the result moves. With the first test’s figures and FHA-style limits of 31% front-end and 43% back-end, the front-end maximum becomes $2,480.00, the back-end room becomes $2,940.00, the binding payment is $2,480.00, the maximum loan is $392,362.83 and the maximum home price is $432,362.83. Raising both limits raises the result, as expected. But raising only the back-end limit does not always help: with the first test’s figures and limits of 28% front-end and 45% back-end, the back-end room rises to $3,100.00, yet the binding payment stays at $2,240.00, because the front-end limit still binds, and the maximum loan and home price do not move at all. A borrower who wants a bigger number has to move the limit that actually binds, not just any limit.
How does a monthly payment become a maximum loan amount?
The step from a monthly payment to a loan amount uses the present-value-of-a-payment formula, which is the same formula lenders use to set a monthly payment on a loan, run in reverse. The formula is: loan = payment × (1 − (1 + r)^−n) ÷ r, where r is the monthly interest rate as a decimal, which is the annual rate divided by 12 and then divided by 100, and n is the number of monthly payments, which is the years multiplied by 12. The part in brackets is the present-value factor: it tells how many dollars of loan one dollar of monthly payment supports at that rate and term.
Take the first verified test and follow the arithmetic. The binding payment is $2,240.00 a month, the rate is 6.5% a year, and the term is 30 years. The monthly rate is 6.5 divided by 12 divided by 100, which is 0.005417. The number of payments is 30 multiplied by 12, which is 360. The factor is (1 − 1.005417^−360) divided by 0.005417, which is 158.21. Multiply the payment by the factor: $2,240.00 multiplied by 158.21 is $354,392.24, which is the maximum loan. The same arithmetic can be checked in reverse: a loan of $354,392.24 at 6.5% over 30 years has a monthly payment of exactly $2,240.00, which closes the loop. The loan calculator runs the same formula forwards, from a loan amount to a monthly payment, so the two pages agree with each other by construction.
The formula has one special case. When the rate is zero, r is 0, and the formula would divide by zero, so the tool takes the direct route instead: the loan is the payment multiplied by the number of months. In the fifth verified test, the first test’s figures at a rate of 0% give a maximum loan of $2,240.00 multiplied by 360, which is $806,400.00, and a maximum home price of $846,400.00 with the $40,000 down payment. A zero rate is not a rate any lender offers on a home loan, but the case shows the formula behaving sensibly at its edge, and it matters for a reader who wants to see what the payment alone would support with no interest at all.
How does the down payment change the maximum home price?
The down payment does not change the maximum loan at all. The loan is set by the binding payment, the rate and the term, and none of those involve the down payment. The down payment changes the maximum home price, dollar for dollar: maximum home price equals maximum loan plus down payment. In the first test, the maximum loan is $354,392.24, so with no down payment the maximum home price is $354,392.24, with the $40,000 down payment it is $394,392.24, and with an $80,000 down payment it would be $434,392.24. Each $10,000 of down payment adds exactly $10,000 to the maximum home price, and nothing to the loan.
That one-for-one effect is the reason saving a larger down payment is the most direct way to raise the price a borrower can reach without raising the monthly payment. It is also the reason a bigger down payment does not raise the amount a lender will lend: the lender’s exposure is the loan, and the loan is capped by the payment the borrower’s income supports. A borrower who saves another $20,000 can buy a $20,000 dearer home at the same monthly payment, but cannot borrow $20,000 more.
The size of the down payment also affects the loan in a second way, through the loan-to-value ratio, which is the loan divided by the home price. A $40,000 down payment on a $394,392.24 home is about 10% down, so the loan-to-value ratio is about 90%. Guides commonly cite 20% down as the traditional figure, 3.5% for FHA loans with a credit score of 580 or higher, and 3% for Fannie Mae’s HomeReady program, and the National Association of Realtors is cited for an average down payment of 11%. Below 20% down, most conventional loans charge private mortgage insurance, which one guide puts at roughly $30 to $70 a month per $100,000 borrowed. That insurance is a monthly cost that comes out of the same housing payment, so it shrinks the part of the payment left for principal and interest, and the loan a lender approves on that payment will be smaller than the figure this tool shows. The tool does not price mortgage insurance, because the cost varies by lender and loan, and the limits section below says so plainly.
How do the interest rate and loan term change what I can afford?
The rate and the term change the maximum loan without touching the binding payment, because they change the present-value factor. A higher rate shrinks the factor, so the same payment supports a smaller loan. A longer term raises the factor, so the same payment supports a larger loan, but with diminishing returns, because the extra years at the end of a long loan add little present value.
The first test’s figures show the rate effect. At 6.5% over 30 years, the maximum loan is $354,392.24 and the maximum home price is $394,392.24. At 5.5% over the same term, the maximum loan rises to $394,512.75 and the maximum home price to $434,512.75. At 7.5%, the maximum loan falls to $320,359.49 and the maximum home price to $360,359.49. A two-point rise in the rate, from 5.5% to 7.5%, cuts the maximum home price by $74,153.26, with the same income, the same debts and the same down payment. The same move can be read the other way round: the loan of $354,392.24 that costs $2,240.00 a month at 6.5% would cost $2,477.96 a month at 7.5%, which is $237.96 more every month for the same home. That is why a rate quote is worth checking with the tool before making an offer, and why a borrower who locks a lower rate can afford a dearer home on the same pay.
The term effect is just as large. The first test’s figures at 6.5% over 15 years instead of 30 give a maximum loan of $257,143.96 and a maximum home price of $297,143.96, against $354,392.24 and $394,392.24 over 30 years. The shorter term cuts the maximum home price by $97,248.28, because the same payment has half as many months to repay the loan. The shorter term does have a benefit the tool does not price: the loan is repaid sooner and the total interest is far lower. The choice between terms is a trade between the price a borrower can reach now and the total cost of the loan over its life, and the loan calculator shows both sides of that trade for a loan amount already chosen.
What do lenders check beyond my debt-to-income ratio?
Debt-to-income is the main affordability lens, but it is not the whole application. Lenders also check credit history and credit score, because the score shapes the rate offered and, in some programs, whether the loan is approved at all. A borrower with a strong score may be offered a lower rate, which raises the maximum loan on the same payment, while a borrower with a weak score may be offered a higher rate or refused. The tool takes the rate as an input, so a borrower who knows the rate they are likely to be offered should enter that rate, not a headline rate from an advertisement.
Lenders also check income stability and employment history, because the ratios assume the income keeps arriving. A borrower with a short time in a job, variable hours, or income that depends on bonuses or overtime may have part of that income discounted or ignored. Self-employed borrowers are usually asked for tax returns rather than payslips, and the income a lender counts can differ from the income the borrower counts. The tool takes gross monthly income as a single figure, so a borrower whose income varies should enter a typical month, or a cautious month, and run the tool for both.
Lenders also look at the property itself. The home is appraised, and the loan is based on the lower of the purchase price and the appraised value, so a home that appraises below its price leaves a gap the borrower must cover. Lenders also check savings and reserves, because a borrower with cash left after the down payment and closing costs is better placed to keep paying if income dips. Some programs allow higher debt-to-income ratios when these compensating factors are strong, which is how the Fannie Mae Selling Guide reaches 45% for manually underwritten loans and up to 50% through its automated underwriting system. The tool’s front-end and back-end fields can be set to those figures, but the result is still an estimate, and the lender’s own calculation governs the application.
What counts as part of the monthly housing payment?
The housing payment in the 28% guidepost is the whole monthly cost of the home, not just the loan payment. It is usually described as PITI plus HOA: principal, interest, property taxes, homeowners insurance, and homeowners association dues where they apply. Mortgage insurance is added where it applies too. The tool’s binding payment is that whole housing budget, and the loan figure assumes the whole payment goes to principal and interest. That assumption is stated in the tool itself, and it matters, because in practice part of the payment must cover tax and insurance, so the loan a lender approves on that payment will be smaller than the figure the tool shows.
A borrower who wants the closest estimate should set aside the tax, insurance and HOA parts before reading the loan figure. The simplest way is to enter a smaller binding payment by hand, using the loan calculator on the reduced figure, or to treat the tool’s loan figure as an upper bound and let the lender’s own calculation set the real number. Property tax varies widely by place, and homeowners insurance varies by the home and the cover chosen, so this page does not invent a figure for either. A borrower who knows the monthly tax and insurance on a home they have in mind can subtract those amounts from the binding payment and run the loan calculator on what is left, which gives the loan that payment supports after tax and insurance are paid.
What does not count in the housing payment is just as important. Utilities, groceries, transport, phone and internet bills, subscriptions and childcare are living expenses, not debts, and they do not enter either ratio. That does not mean they do not matter to a budget. It means the ratios are not a budget, and a borrower who passes both guideposts can still feel squeezed if those other expenses are large. The remaining income after debts is the figure to check against those expenses, and the debt to income calculator shows it directly, while the take home pay calculator shows what gross pay becomes after tax, which is the income the monthly bills actually come out of.
What are the limits of this calculator?
This calculator gives an estimate from the 28/36 guideposts, and it gives no financial advice, approves no loan, checks no credit, and replaces no lender’s formal offer. It does not model property tax, homeowners insurance, HOA dues or mortgage insurance, and the loan figure assumes the whole binding payment goes to principal and interest. A lender’s own calculation will set aside those costs first, so the loan a lender approves will be smaller than the figure shown here. It does not model closing costs, moving costs, or the cash a borrower needs left over after the down payment, all of which come out of savings rather than the monthly payment.
It assumes a fixed rate for the whole term and equal monthly payments, with no extra payments and no missed payments. With a variable rate, the payment can change when the rate changes, so a single figure is a snapshot, not a promise for the whole term. It does not model loan programs with their own limits, such as FHA, VA or USDA loans, beyond letting the reader change the front-end and back-end fields to those programs’ benchmarks. It does not check whether a borrower meets a program’s other conditions, such as a minimum credit score or a maximum loan amount for the area.
It takes gross monthly income as a single figure and does not check whether a lender would count all of it. Income that varies, income from a short employment history, and self-employed income may all be counted differently by a lender. It takes other monthly debts as a single figure and does not check whether a lender would count a debt the reader left out, such as a co-signed loan or a student loan in deferment, where many lenders use an estimated payment rather than zero. The EMI calculator can work out the monthly instalment on a loan before it is entered as a debt here. Finally, it gives no advice on whether to buy, how much to borrow, or which loan to choose. Those are decisions for the borrower, and where the sums are large or the terms are unclear, a qualified adviser is the right person to ask.
How can I check the tool against a known result?
The simplest check uses the first verified test. Enter a gross monthly income of $8,000, other monthly debts of $500, a down payment of $40,000, a rate of 6.5% and a term of 30 years, with the limits at 28 and 36. The tool should show a maximum monthly housing payment of $2,240.00, a maximum total debt payment of $2,880.00, a binding monthly payment of $2,240.00, a maximum loan of $354,392.24 and a maximum home price of $394,392.24, with a note saying the front-end limit binds. Enter that loan in the loan calculator at the same rate and term, and it should show a monthly payment of $2,240.00, which closes the loop.
A second check uses the third test. Enter $12,000, $1,500, $100,000, 6% and 15 years. The tool should show a front-end maximum of $3,360.00, a back-end maximum of $4,320.00, a binding payment of $2,820.00, a maximum loan of $334,179.91 and a maximum home price of $434,179.91, with a note saying the back-end limit binds. A third check uses the zero-rate test: enter the first test’s figures with a rate of 0%, and the tool should show a maximum loan of $806,400.00 and a maximum home price of $846,400.00.
A fourth check tests the error for a back-end limit used up by other debts. Enter a gross monthly income of $3,000, other monthly debts of $1,200, a down payment of $0, a rate of 6.5% and a term of 30 years. The back-end maximum is 36% of $3,000, which is $1,080.00, so the room left for housing is $1,080.00 minus $1,200, which is −$120.00, below zero. The tool should show the error saying the other debts already use up the back-end limit, and no results.
The authoritative source for the guideposts is the Consumer Financial Protection Bureau, whose page What is a debt-to-income ratio? defines DTI as a percentage of a borrower’s gross monthly income that goes toward paying debts, gives the example of a borrower earning $6,000 a month with a total debt payment of $2,000, and says a DTI of 43% is often the highest ratio a borrower can have and still get a qualified mortgage. The Bureau’s separate guide to buying a house says a DTI of 43% or lower is needed to qualify for a qualified mortgage. More tools in the same collection are in the calculators category.
What is the maximum loan for a $2,000 monthly payment?
The table below gives the maximum loan for a fixed monthly payment of $2,000, at the rates a borrower is likely to see, over 15 years and over 30 years. Read a row to see what the same payment buys at a given rate and term. The loan at 6% over 30 years is $333,583.23; over 15 years it is $237,007.03. The same payment buys less loan at a higher rate and over a shorter term, and more loan at a lower rate and over a longer term.
Two patterns in the table are worth noting. First, the 30-year column falls faster than the 15-year column as the rate rises: from 6% to 7.5%, the 30-year loan falls by $47,547.98, from $333,583.23 to $286,035.25, while the 15-year loan falls by $21,260.18, from $237,007.03 to $215,746.85. The longer term is more sensitive to the rate, because more of its payments sit in the distant future, where the discounting bites hardest. Second, the gap between the two columns narrows as the rate rises: at 6% the 30-year loan is $96,576.20 larger than the 15-year loan, and at 7.5% it is $70,288.40 larger. At a high enough rate the two columns would meet, because a payment discounted at a very high rate has almost no present value beyond the first few years, however long the term runs. A borrower who reads the table should also remember that these are loan figures for a $2,000 payment of principal and interest only, before tax, insurance and any other housing costs are set aside.
| Annual rate | Maximum loan at 15 years | Maximum loan at 30 years |
|---|---|---|
| 6.0% | $237,007.03 | $333,583.23 |
| 6.5% | $229,592.82 | $316,421.64 |
| 7.0% | $222,511.92 | $300,615.14 |
| 7.5% | $215,746.85 | $286,035.25 |
Frequently asked questions
How much home loan can I qualify for on my salary?
Your salary is a guide, not a rule on its own. Take your gross monthly pay, which is your annual salary divided by 12, and apply the 28/36 guideposts. On a salary of $96,000 a year, your gross monthly income is $8,000, the front-end maximum is $2,240 a month, and at 6.5% over 30 years with a $40,000 down payment the maximum home price is $394,392.24. On a salary of $60,000 a year, your gross monthly income is $5,000, the front-end maximum is $1,400 a month, and at 7% over 30 years with a $20,000 down payment the maximum loan is $210,430.60 and the maximum home price is $230,430.60. Your other debts, the rate and the term move those figures, so run the tool on your own numbers rather than trusting a salary multiple.
What is the 28/36 rule for a mortgage?
It is a long-used guideline, not a lending rule. The 28% part says your total monthly housing payment should not exceed 28% of your gross monthly income. The 36% part says your housing payment plus every other monthly debt payment should not exceed 36% of your gross monthly income. Both are measured against gross income, which is income before tax and other deductions are taken out. The two numbers act together: the front-end limit caps housing on its own, and the back-end limit caps it again once your other debts are counted.
What debt-to-income ratio do lenders actually accept?
It depends on the lender and the loan program. The 36% back-end figure in this tool is a guidepost, not a ceiling. Many lenders accept a back-end ratio of 43%, which is often cited as the highest ratio for a qualified mortgage, and some programs accept up to 45% or 50% when the rest of the application is strong. FHA loans are often cited at 31% front-end and 43% back-end. A borrower with strong credit, stable employment and savings left over after the down payment may be approved above 36%, while a borrower without those factors may be held to a lower ratio. The tool lets you change the limits to the figures your lender uses.
Does the down payment change how much I can borrow?
No. The down payment does not change the maximum loan, because the loan is set by the binding monthly payment, the interest rate and the loan term, and none of those involve the down payment. The down payment changes the maximum home price, dollar for dollar: maximum home price equals maximum loan plus down payment. With a maximum loan of $354,392.24, a $40,000 down payment gives a maximum home price of $394,392.24, no down payment gives $354,392.24, and an $80,000 down payment gives $434,392.24. A larger down payment also lowers the loan-to-value ratio, and below 20% down most conventional loans charge mortgage insurance, which is a monthly cost that comes out of the same housing payment.
Is this calculator the same as a mortgage pre-approval?
No. This calculator is an estimate from the 28/36 guideposts. It asks for seven figures and applies a formula, and it does not check your credit, your employment, your documents, or the property itself. A pre-approval is a lender’s conditional commitment, based on a credit check, income verification and a review of your debts, and it states a loan amount the lender is willing to lend, subject to the property appraising and the figures being confirmed. This tool is useful for deciding what price to look at before you apply, and for testing how paying down a debt or saving a larger down payment would move the result. It is not a substitute for pre-approval, and the figures on this page are for general information only.
Why does my maximum fall when my other debts rise?
Because your other debts shrink the room left for a housing payment under the back-end limit. The back-end maximum is a percentage of your income, fixed at 36% unless you change it, and the room for housing is that maximum minus your other debts. Every dollar of other debt takes a dollar off the room. When the room falls below the front-end maximum, the room binds, and the maximum loan is set by the room instead. In the fourth verified test, a borrower earning $6,000 a month with $1,200 a month of other debts has a back-end room of only $960.00, against a front-end maximum of $1,680.00, so the maximum loan is $151,882.39 instead of the $265,794.18 the same borrower would have with no other debts. At 6.5% over 30 years, each $100 a month of other debt cuts the maximum loan by $15,821.08, so paying down a debt before applying is often the fastest way to raise the maximum.