Stats Score Calculator
Stats Score Calculator
Turn any score into a z-score and percentile — or work backwards from a z-score to the raw score.
A stats score calculator turns any score into a z-score, which says how many standard deviations the score sits above or below the mean. Enter a value, a mean and a standard deviation, and it gives you the z-score, the percentile, and the share of values below and above it — or work backwards from a z-score to the raw score.
What is a z-score?
A z-score, also called a standard score, measures how far one value sits from the mean of its group, counted in standard deviations instead of the original units. A z-score of 0 means the value equals the mean exactly. A z-score of +1 means the value is one standard deviation above the mean. A z-score of −2 means it is two standard deviations below the mean.
The point of the z-score is that it removes the units. A score of 85 on one test and a score of 118 on another cannot be compared directly, because the tests have different means and different spreads. Turn both into z-scores and they sit on the same scale: a mean of 0 and a standard deviation of 1. A z-score of 1.50 on the first test and a z-score of 1.20 on the second tells you at once that the first result was stronger relative to its group.
Z-scores show up wherever a single number needs judging against a group. Teachers use them to compare exam results across classes. Psychologists use them on standardised tests — IQ scores are built on a mean of 100 and a standard deviation of 15, so an IQ of 130 is simply a z-score of 2.00. The World Health Organization uses z-scores in its Child Growth Standards to judge whether a child's height, weight or BMI sits within a healthy range. In finance, the Altman Z-score model, published by Edward Altman in 1968, combines five ratios into one score used to gauge bankruptcy risk.
How do you calculate a z-score?
The formula is z = (x − μ) / σ. Here x is the raw value, μ (mu) is the mean of the group, and σ (sigma) is the standard deviation of the group. Subtract the mean from the value, then divide by the standard deviation. The subtraction centres the value on the mean; the division rescales the distance into standard-deviation units.
Take a test where the class mean is 70 and the standard deviation is 10. A student who scored 85 gets z = (85 − 70) / 10 = 15 / 10 = 1.50. The score is 1.5 standard deviations above the mean. A student who scored 60 gets z = (60 − 70) / 10 = −10 / 10 = −1.00 — exactly one standard deviation below the mean.
Two conditions matter before you use the formula. First, the value, the mean and the standard deviation must all be in the same unit — you cannot mix a score in points with a mean in percent. Second, the standard deviation must be greater than zero. A group with no spread has every value equal to the mean, and there is no scale on which to measure a distance from it. This calculator refuses a standard deviation of zero or less and asks for a positive number instead.
If your numbers come from a sample rather than a whole population, the formula is the same shape: z = (x − x̄) / s, where x̄ is the sample mean and s is the sample standard deviation. The symbol changes; the arithmetic does not. If you need the mean or the standard deviation from a list of numbers first, the Mean Median Mode Calculator finds the mean of a data set, and the SE Calculator works out a standard deviation from a list of numbers.
How do you turn a z-score into a percentile?
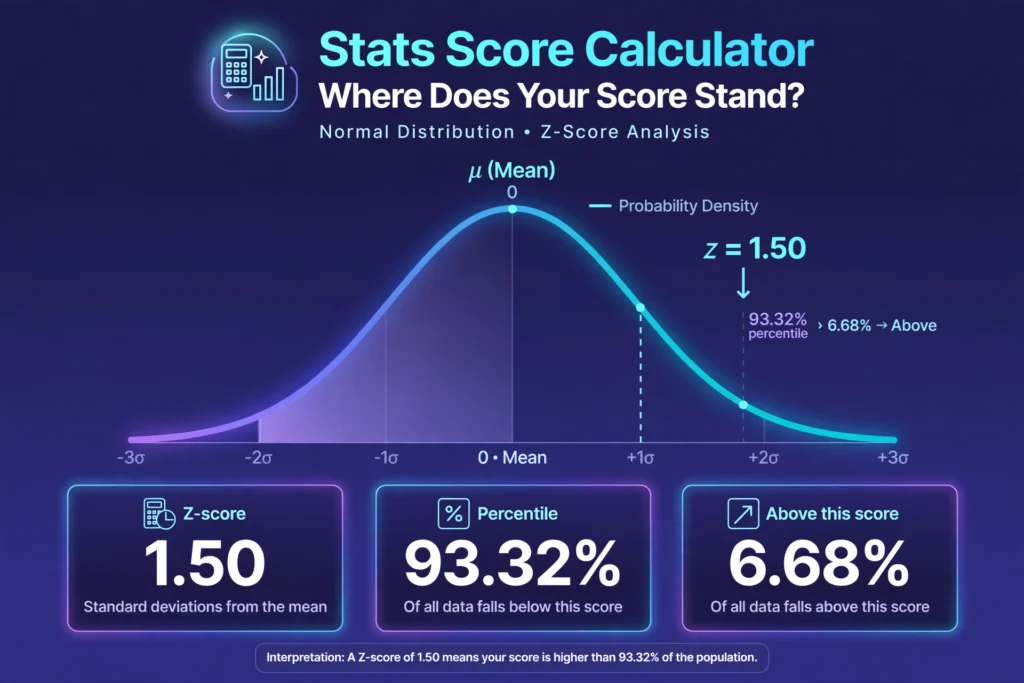
A percentile says what share of values fall below a given value. On a normal distribution, each z-score matches exactly one percentile, and the link between them is the standard normal cumulative distribution function, written Φ(z). The percentile is Φ(z) × 100. For z = 1.50, Φ(1.50) is 0.9332, so the value sits at the 93.32nd percentile — about 93.32% of values fall below it and 6.68% fall above it.
There is no simple formula for Φ(z), so in practice it is read from a printed z-table or computed with an approximation. This calculator uses the Abramowitz & Stegun 7.1.26 approximation, which matches a printed z-table to four decimal places. Before computers, students looked the value up in a table at the back of a textbook; the calculator does the same lookup, only faster and to more decimals.
The table below gives the percentile for the z-scores people look up most often. It was computed from the same function this calculator uses, so the numbers match what the tool shows.
| Z-score | Percentile | Share above |
|---|---|---|
| −3.0 | 0.13% | 99.87% |
| −2.5 | 0.62% | 99.38% |
| −2.0 | 2.28% | 97.72% |
| −1.5 | 6.68% | 93.32% |
| −1.0 | 15.87% | 84.13% |
| −0.5 | 30.85% | 69.15% |
| 0.0 | 50.00% | 50.00% |
| 0.5 | 69.15% | 30.85% |
| 1.0 | 84.13% | 15.87% |
| 1.5 | 93.32% | 6.68% |
| 2.0 | 97.72% | 2.28% |
| 2.5 | 99.38% | 0.62% |
| 3.0 | 99.87% | 0.13% |
Notice how the percentiles bunch up near the ends. Moving from z = 2.00 to z = 3.00 only moves the percentile from 97.72% to 99.87%, but the share above shrinks from 2.28% to 0.13% — roughly 17 times rarer. That is why the "share above" column matters as much as the percentile: near the top of the scale, a small change in z means a large change in how unusual the value is.
How do you read a z-score?
Read the sign first, then the size. The sign says which side of the mean the value sits on: positive is above, negative is below, zero is exactly average. The size says how far out it is, in standard deviations.
Between −1 and +1 is everyday territory. About 68% of values in a normal distribution fall in that band, so a z-score of 0.50 or −0.75 describes an ordinary value that happens to sit a little off centre. Between 1 and 2 — or between −1 and −2 — is clearly above or below average: the value beats roughly 84% to 97.7% of the group on the high side. Beyond ±2 is unusual, and beyond ±3 is rare enough to double-check: fewer than 0.3% of values fall that far out in either direction.
A z-score of 1.50, the main example on this page, is a good illustration. It sits at the 93.32nd percentile, so the score beats about 93 out of every 100 values. That is strong, but it is not extreme — about 7 in 100 values are still higher. A z-score of 2.67, from a score of 140 on the IQ scale, is a different matter: the 99.62nd percentile, with only 0.38% above it.
One common mix-up is reading a z-score as a percentage. It is not one. A z-score of 1.50 does not mean 150% of anything, and it does not mean the score is 1.5% above average. It means the value is 1.5 standard deviations above the mean, which happens to place it at the 93.32nd percentile. Keep the two numbers apart and the reading stays clear.
What is a good z-score?
There is no single answer, because "good" depends entirely on what you are measuring. On an exam, a z-score of +1 (the 84.13th percentile) is a result most students would take, and +2 is exceptional. But if the whole class found the test easy and scores bunched at the top, the standard deviation shrinks, and a modest raw gap can inflate into a large z-score — the number looks better than the performance behind it.
In quality control the answer flips. A factory measuring bottle fill weights wants z-scores near 0, because 0 means the bottle is exactly on target. A z-score of +2.8 on fill weight means that bottle is far off target and worth pulling from the line. Quality teams often flag anything beyond ±3 as an outlier to investigate.
In research, the question is usually whether a z-score clears a threshold. A z-score beyond ±1.96 marks the outer 5% of the distribution — 2.5% in each tail — and is the classic cutoff for statistical significance at the 5% level. A z-score of 1.645 marks the 95th percentile and is the cutoff for a one-sided 95% test. These are conventions, not laws of nature, and they only mean something when the data behind them is sound.
The honest rule is this: a z-score is good when it points the way you want it to point, for the thing you are measuring. Ask what a high value means in your setting before deciding whether to celebrate it.
What is the 68-95-99.7 rule?
The 68-95-99.7 rule, also called the empirical rule, is a shortcut for reading a normal distribution without a table. About 68% of values fall within one standard deviation of the mean, about 95% within two, and about 99.7% within three. The exact shares, computed from the same function this calculator uses, are 68.27%, 95.45% and 99.73%.
The rule is useful as a gut check. If someone reports a z-score of 2.5, you already know — without computing anything — that fewer than 5% of values sit that far out on that side. The exact percentile for +2.5 is the 99.38th, so the rule gets you close, and the calculator gives you the precise figure.
The rule also explains why z-scores beyond ±3 deserve a second look. Only about 0.27% of values in a normal distribution fall outside three standard deviations in total. When one shows up in real data, it is usually either a genuinely rare case or a mistake — a mistyped number, a wrong unit, a broken sensor. Either way, it is worth checking before acting on it.
Remember that the rule describes a normal distribution. Real data is only roughly bell-shaped, and for skewed data the shares shift. A z-score of 2 on a heavily skewed income distribution does not carry the same meaning as a z-score of 2 on a test-score distribution. The rule is a guide, not a guarantee.
How do z-scores let you compare scores from different tests?
Different tests have different means and different spreads, so raw scores cannot be compared across them. Z-scores fix that by putting every score on the same scale.
Take two students. Ana scored 85 on a maths test with a mean of 70 and a standard deviation of 10 — z = 1.50, the 93.32nd percentile. Ben scored 118 on a reading test with a mean of 100 and a standard deviation of 15 — z = 1.20, the 88.49th percentile. Ben's raw score is higher, but Ana's result is stronger relative to her group: she beat 93.32% of her classmates, while Ben beat 88.49% of his.
The same trick works across years, subjects, and even kinds of measurement. A university comparing applicants from schools with different grading scales, a coach comparing athletes across events, or a researcher combining results from studies that used different instruments — all of them use standardisation to make unlike numbers comparable. That is the whole job of the z-score: one scale, any data.
There is one condition. The comparison is only fair when both distributions are roughly normal and the means and standard deviations are honest summaries of their groups. If one test was far easier than the other, or one group was far smaller, the z-scores still compare — but the comparison inherits whatever weakness the summary numbers carry.
How do you go from a z-score back to a raw score?
Sometimes the z-score is the starting point and the raw score is the question. A university might say it accepts students at the 97.72nd percentile, or a test manual might report results only as z-scores. The reverse formula is x = μ + zσ: multiply the z-score by the standard deviation, then add the mean.
On the IQ scale, with a mean of 100 and a standard deviation of 15, a z-score of 2.00 becomes x = 100 + 2.00 × 15 = 130. A z-score of −1.50 becomes x = 100 + (−1.50) × 15 = 77.50. The first sits at the 97.72nd percentile; the second at the 6.68th percentile.
The reverse direction is also how cutoffs are set. If a programme wants the top 5% of applicants, it needs the 95th percentile, which is z = 1.645. On a test with a mean of 75 and a standard deviation of 8, the cutoff score is x = 75 + 1.645 × 8 = 88.16 — so a score of 89 or above clears it. Switch this calculator to "Z-score to value" mode and it does the same arithmetic for any mean and standard deviation you enter.
Students on the AP Statistics exam do this step with the invNorm function on a TI-84: invNorm(0.95, 0, 1) gives about 1.645. The calculator above gives the same answer without the handheld — and the percentile shown beside the raw score lets you check the result at a glance.
When should you use a z-score, and when should you not?
Use a z-score when you need to compare a value with its group, compare values from different groups, or find a percentile or probability for a value. Exam scores, standardised tests, growth measurements, quality-control readings and research results are all natural fits — any setting where "how far from average, and in what direction" is the question that matters.
Use the population standard deviation when you know the whole group's spread, and the sample standard deviation when you are working from a sample. With a large sample — conventionally 30 or more — the sample standard deviation is a close stand-in for the population value, and the z-score behaves well. With a small sample and an unknown population standard deviation, Student's t distribution is the safer choice: it has heavier tails, which accounts for the extra uncertainty of estimating the spread from your own data. This calculator reports z-scores; for small-sample inference, a t-based tool is the right next step.
Do not use a z-score to turn a percentile into a claim about real data that is not bell-shaped. The percentile and the probabilities on this page come from the normal distribution. If your data is skewed — incomes, house prices, waiting times — a high z-score does not carry the same tail probability, and the percentile will mislead. The z-score itself is still a fair description of distance from the mean; only the probability reading needs the bell shape.
Do not use a z-score when the mean and standard deviation are not honest summaries of the group. A mean dragged up by a few extreme values, or a standard deviation computed from a group that mixes two very different populations, will produce z-scores that flatter or punish values for the wrong reasons. Look at the data first; standardise second.
What mistakes do people make with z-scores?
The most common mistake is treating the percentile as exact when the data is not normal. A z-score of 1.50 is the 93.32nd percentile of a normal distribution — but if the real data is skewed, the true share below that value could be quite different. The percentile is a property of the bell curve, not of your data, unless your data follows the curve.
The second mistake is confusing the z-score with the percentile. A z-score of 1.50 is not "150%", and a z-score of 0.50 is not the 50th percentile — it is the 69.15th. The two numbers are linked by the table above, but they are different quantities, and swapping them gives a wrong answer.
The third mistake is using the wrong standard deviation. Population and sample standard deviations differ — one divides by n, the other by n − 1 — and using the wrong one shifts every z-score a little. With large groups the difference is tiny; with small groups it matters. Know which one your data calls for before you calculate.
The fourth mistake is forgetting the units. The value, the mean and the standard deviation must all be in the same unit. A mean in centimetres and a value in inches will produce a z-score that means nothing. Convert first, calculate second.
The fifth mistake is reading too much into a single z-score. One value, however extreme, is one value. A z-score of 2.67 says the value is rare for its group — it does not say why. Before acting on it, check the measurement, check the data, and check whether the group it was compared against is the right group at all.
How do you use this stats score calculator?
Choose "Value to z-score" to start from a raw score. Enter your value, the mean of the group, and the standard deviation, then press the button. The calculator shows the z-score, the percentile, and the share of values below and above yours, plus a plain-language reading of what the number means. The defaults — value 85, mean 70, standard deviation 10 — give z = 1.50 and the 93.32nd percentile, so you can see a worked result before typing anything.
Choose "Z-score to value" to start from a z-score. Enter the z-score, the mean and the standard deviation, and the calculator gives you the raw score that matches it, with the percentile beside it. The defaults — z = 2.00, mean 100, standard deviation 15 — give a raw score of 130.00, the 97.72nd percentile.
If you only have a list of numbers and no mean or standard deviation yet, work those out first: the Mean Median Mode Calculator finds the mean of a data set, and the SE Calculator works out a standard deviation from a list of numbers. Then bring the two numbers back here. If your scores are letter grades rather than numbers, the GPA Calculator turns letter grades into a GPA, and the Grade Calculator with Weights weights each test by its share of the final grade.
Worked example
Take a student who scored 85 on a test where the class mean is 70 and the standard deviation is 10. The z-score is z = (85 − 70) / 10 = 1.50. The percentile is 93.32%, so the score beats about 93 out of every 100 students in the class, and only 6.68% scored higher.
Now the same test, a different student. A score of 60 gives z = (60 − 70) / 10 = −1.00 — exactly one standard deviation below the mean, at the 15.87th percentile, with 84.13% of the class above it. The two students sit on opposite sides of the mean, and their percentiles — 93.32% and 15.87% — add with their complements to 100%, as they must.
A third case shows the reverse direction. An IQ of 118, on the scale with mean 100 and standard deviation 15, gives z = (118 − 100) / 15 = 1.20 — the 88.49th percentile, with 11.51% of the population above it. And a score of 140 on the same scale gives z = 2.67 — the 99.62nd percentile, with only 0.38% above it.
Finally, the reverse mode. A z-score of 2.00 on the IQ scale is a raw score of x = 100 + 2.00 × 15 = 130.00, at the 97.72nd percentile. A z-score of −1.50 is x = 100 + (−1.50) × 15 = 77.50, at the 6.68th percentile. One formula, both directions, and the same bell curve underneath.
This page gives general information about z-scores and how the numbers work. It is not statistical advice for any particular decision, and it does not take your full situation into account. Percentiles and probabilities assume a normal distribution; check whether your data is roughly bell-shaped before relying on them.
What is a stats score calculator?
A stats score calculator turns a raw score into a z-score, which says how many standard deviations the score sits above or below the mean of its group. Enter a value, a mean and a standard deviation, and it gives you the z-score, the percentile, and the share of values below and above it. This calculator also works backwards, turning a z-score into the raw score that matches it.
How do you calculate a z-score?
Subtract the mean from the value, then divide by the standard deviation: z = (x − μ) / σ. For example, a score of 85 with a mean of 70 and a standard deviation of 10 gives z = (85 − 70) / 10 = 1.50. A positive z-score is above the mean, a negative one is below it, and zero means the value equals the mean.
How do you convert a z-score to a percentile?
The percentile is the area under the standard normal curve to the left of the z-score, written Φ(z) × 100. For z = 1.50 the percentile is 93.32%, so about 93.32% of values fall below it. The quick-reference table above lists the percentile for the most common z-scores, from −3.0 (0.13%) to +3.0 (99.87%).
What is a good z-score?
It depends on what you are measuring. On an exam, a z-score of +1 (the 84.13th percentile) is above average and +2 is exceptional. In quality control, a z-score near 0 is best, because it means the measurement is on target. In research, a z-score beyond ±1.96 marks the outer 5% of the distribution. There is no single good value — it depends on the setting.
Can a z-score be negative?
Yes. A negative z-score means the value is below the mean. A score of 60 on a test with a mean of 70 and a standard deviation of 10 gives z = −1.00, at the 15.87th percentile, with 84.13% of scores above it. The more negative the z-score, the further below average the value sits.
How do you find a raw score from a z-score?
Use the reverse formula x = μ + zσ: multiply the z-score by the standard deviation, then add the mean. On the IQ scale (mean 100, standard deviation 15), a z-score of 2.00 gives x = 100 + 2.00 × 15 = 130. Switch this calculator to "Z-score to value" mode and it does the same arithmetic for any mean and standard deviation.